Cesium中高性能加载20W+不同颜色立方体方案
·
一、静态加载
在Cesium中通过primitives批量加载20W+立方体
<!doctype html>
<html lang="en">
  <head>
    <meta charset="utf-8" />
    <link
      rel="stylesheet"
      href="https://cesium.com/downloads/cesiumjs/releases/1.83/Build/Cesium/Widgets/widgets.css"
    />
    <!-- 引入 Cesium 的 JavaScript 库 -->
    <script src="https://cesium.com/downloads/cesiumjs/releases/1.83/Build/Cesium/Cesium.js"></script>
    <style>
      html,
      body,
      #cesiumContainer {
        width: 100%;
        height: 100%;
        margin: 0;
        padding: 0;
        overflow: hidden;
      }
    </style>
    <script src="./main-road.js"></script>
  </head>

  <body>
    <div id="cesiumContainer"></div>
    <script>
      Cesium.Ion.defaultAccessToken =
        "defaultAccessToken";

      const viewer = new Cesium.Viewer("cesiumContainer", {
        // terrain: Cesium.Terrain.fromWorldTerrain(), // 开启地形(可选)
      });

      viewer.scene.globe.depthTestAgainstTerrain = true;

      // ==========================================
      // 核心:直接用 scene.primitives.add
      // ==========================================
      const rectangleInstances = [];
      const total = 300000;

      // 深圳附近(保证能看到)
      const minLon = 113.9;
      const maxLon = 114.1;
      const minLat = 22.4;
      const maxLat = 22.6;

      for (let i = 0; i < total; i++) {
        const lon = Cesium.Math.randomBetween(minLon, maxLon);
        const lat = Cesium.Math.randomBetween(minLat, maxLat);
        const height = Cesium.Math.randomBetween(20, 200);

        const rect = Cesium.Rectangle.fromDegrees(
          lon,
          lat,
          lon + 0.0003,
          lat + 0.0003,
        );

        const instance = new Cesium.GeometryInstance({
          geometry: new Cesium.RectangleGeometry({
            rectangle: rect,
            height: height, // 离地高度
            extrudedHeight: height + 10, // 拉伸高度
            vertexFormat: Cesium.PerInstanceColorAppearance.VERTEX_FORMAT,
          }),
          attributes: {
            color: Cesium.ColorGeometryInstanceAttribute.fromColor(
              Cesium.Color.fromRandom({ alpha: 1 }),
            ),
          },
        });

        rectangleInstances.push(instance);
      }

      // 正确添加方式:scene.primitives.add
      viewer.scene.primitives.add(
        new Cesium.Primitive({
          geometryInstances: rectangleInstances,
          appearance: new Cesium.PerInstanceColorAppearance({
            closed: true,
            translucent: false,
          }),
          asynchronous: false,
        }),
      );

      // 飞到位置
      viewer.camera.flyTo({
        destination: Cesium.Rectangle.fromDegrees(113.9, 22.4, 114.1, 22.6),
        duration: 1.5,
      });
    </script>
  </body>
</html>
二、动态加载
1、生成SHP文件,以Python为例
import geopandas as gpd
import numpy as np
import os
from shapely.geometry import Polygon  # <--- 添加这一行即可解决报错

def generate_cube_shp_optimized(output_dir="cube_shp_data_rgb", num_cubes=100):
    """
    生成带有独立RGB颜色字段的SHP文件,以完美兼容CesiumLab
    """
    # 1. 创建输出目录
    if not os.path.exists(output_dir):
        os.makedirs(output_dir)

    polygons, heights = [], []
    colors_r, colors_g, colors_b = [], [], []

    # 2. 循环生成随机立方体数据
    for _ in range(num_cubes):
        # 随机生成中心点坐标 (长沙附近区域)
        center_x = np.random.uniform(112.9, 113.0)
        center_y = np.random.uniform(28.1, 28.2)

        # 设置立方体底面的边长
        size = 0.0005
        half_size = size / 2

        # 创建闭合的矩形面
        polygon = gpd.pd.Series([Polygon([
            (center_x - half_size, center_y - half_size),
            (center_x + half_size, center_y - half_size),
            (center_x + half_size, center_y + half_size),
            (center_x - half_size, center_y + half_size),
            (center_x - half_size, center_y - half_size)
        ])])[0]
        polygons.append(polygon)

        # 赋予高度属性 (10 到 100 米)
        heights.append(np.random.randint(10, 100))

        # 生成独立的 RGB 颜色值 (0-255)
        colors_r.append(np.random.randint(0, 256))
        colors_g.append(np.random.randint(0, 256))
        colors_b.append(np.random.randint(0, 256))

    # 3. 构建 GeoDataFrame
    gdf = gpd.GeoDataFrame({
        'geometry': polygons,
        'height': heights,      # 高度字段
        'color_r': colors_r,    # 红色通道
        'color_g': colors_g,    # 绿色通道
        'color_b': colors_b     # 蓝色通道
    })

    # 4. 设置坐标系 (WGS84)
    gdf.set_crs(epsg=4326, inplace=True)

    # 5. 导出为 Shapefile
    output_path = os.path.join(output_dir, "cubes_rgb.shp")
    gdf.to_file(output_path, driver="ESRI Shapefile")

    print(f"成功生成 {num_cubes} 个带RGB颜色的立方体数据!")
    print(f"文件保存路径: {os.path.abspath(output_dir)}")

# 执行生成函数
if __name__ == "__main__":
    generate_cube_shp_optimized()
网格化生成策略(立方体不重叠)
import geopandas as gpd
import numpy as np
import os
from shapely.geometry import Polygon
import itertools

def generate_cube_shp_optimized(output_dir="cube_shp_data_rgb", num_cubes=200000):
    """
    基于网格算法生成不重叠的立方体SHP文件
    """
    # 1. 创建输出目录
    if not os.path.exists(output_dir):
        os.makedirs(output_dir)

    # 2. 定义区域与网格参数
    x_min, x_max = 112.9, 113.0
    y_min, y_max = 28.1, 28.2
    size = 0.000125  # 立方体边长
    half_size = size / 2

    # 计算网格步长(这里设置为刚好放下一个立方体,即无间隙)
    # 如果想让立方体之间有间距,可以将 step 调大,例如 size * 1.2
    step = size

    # 3. 生成所有可能的不重叠网格中心点
    x_centers = np.arange(x_min + half_size, x_max - half_size, step)
    y_centers = np.arange(y_min + half_size, y_max - half_size, step)

    # 使用 itertools.product 生成所有 (x, y) 组合
    all_positions = list(itertools.product(x_centers, y_centers))
    total_available = len(all_positions)

    if num_cubes > total_available:
        print(f"警告:请求生成 {num_cubes} 个立方体,但当前区域最多只能容纳 {total_available} 个不重叠立方体。")
        print(f"已自动将数量调整为最大值 {total_available}。")
        num_cubes = total_available

    # 4. 随机抽取指定数量的位置(保证绝对不重叠)
    np.random.shuffle(all_positions)
    selected_positions = all_positions[:num_cubes]

    # 5. 批量生成属性数据
    polygons = []
    heights = np.random.randint(10, 100, size=num_cubes)
    colors_r = np.random.randint(0, 256, size=num_cubes)
    colors_g = np.random.randint(0, 256, size=num_cubes)
    colors_b = np.random.randint(0, 256, size=num_cubes)

    # 批量创建多边形
    for center_x, center_y in selected_positions:
        polygon = Polygon([
            (center_x - half_size, center_y - half_size),
            (center_x + half_size, center_y - half_size),
            (center_x + half_size, center_y + half_size),
            (center_x - half_size, center_y + half_size),
            (center_x - half_size, center_y - half_size)
        ])
        polygons.append(polygon)

    # 6. 构建 GeoDataFrame
    gdf = gpd.GeoDataFrame({
        'geometry': polygons,
        'height': heights,
        'color_r': colors_r,
        'color_g': colors_g,
        'color_b': colors_b
    })

    # 7. 设置坐标系并导出
    gdf.set_crs(epsg=4326, inplace=True)
    output_path = os.path.join(output_dir, "cubes_rgb.shp")
    gdf.to_file(output_path, driver="ESRI Shapefile")

    print(f"成功生成 {num_cubes} 个无重叠的带RGB颜色立方体数据!")
    print(f"文件保存路径: {os.path.abspath(output_path)}")

# 执行生成函数
if __name__ == "__main__":
    generate_cube_shp_optimized()
2、CesiumLab中处理
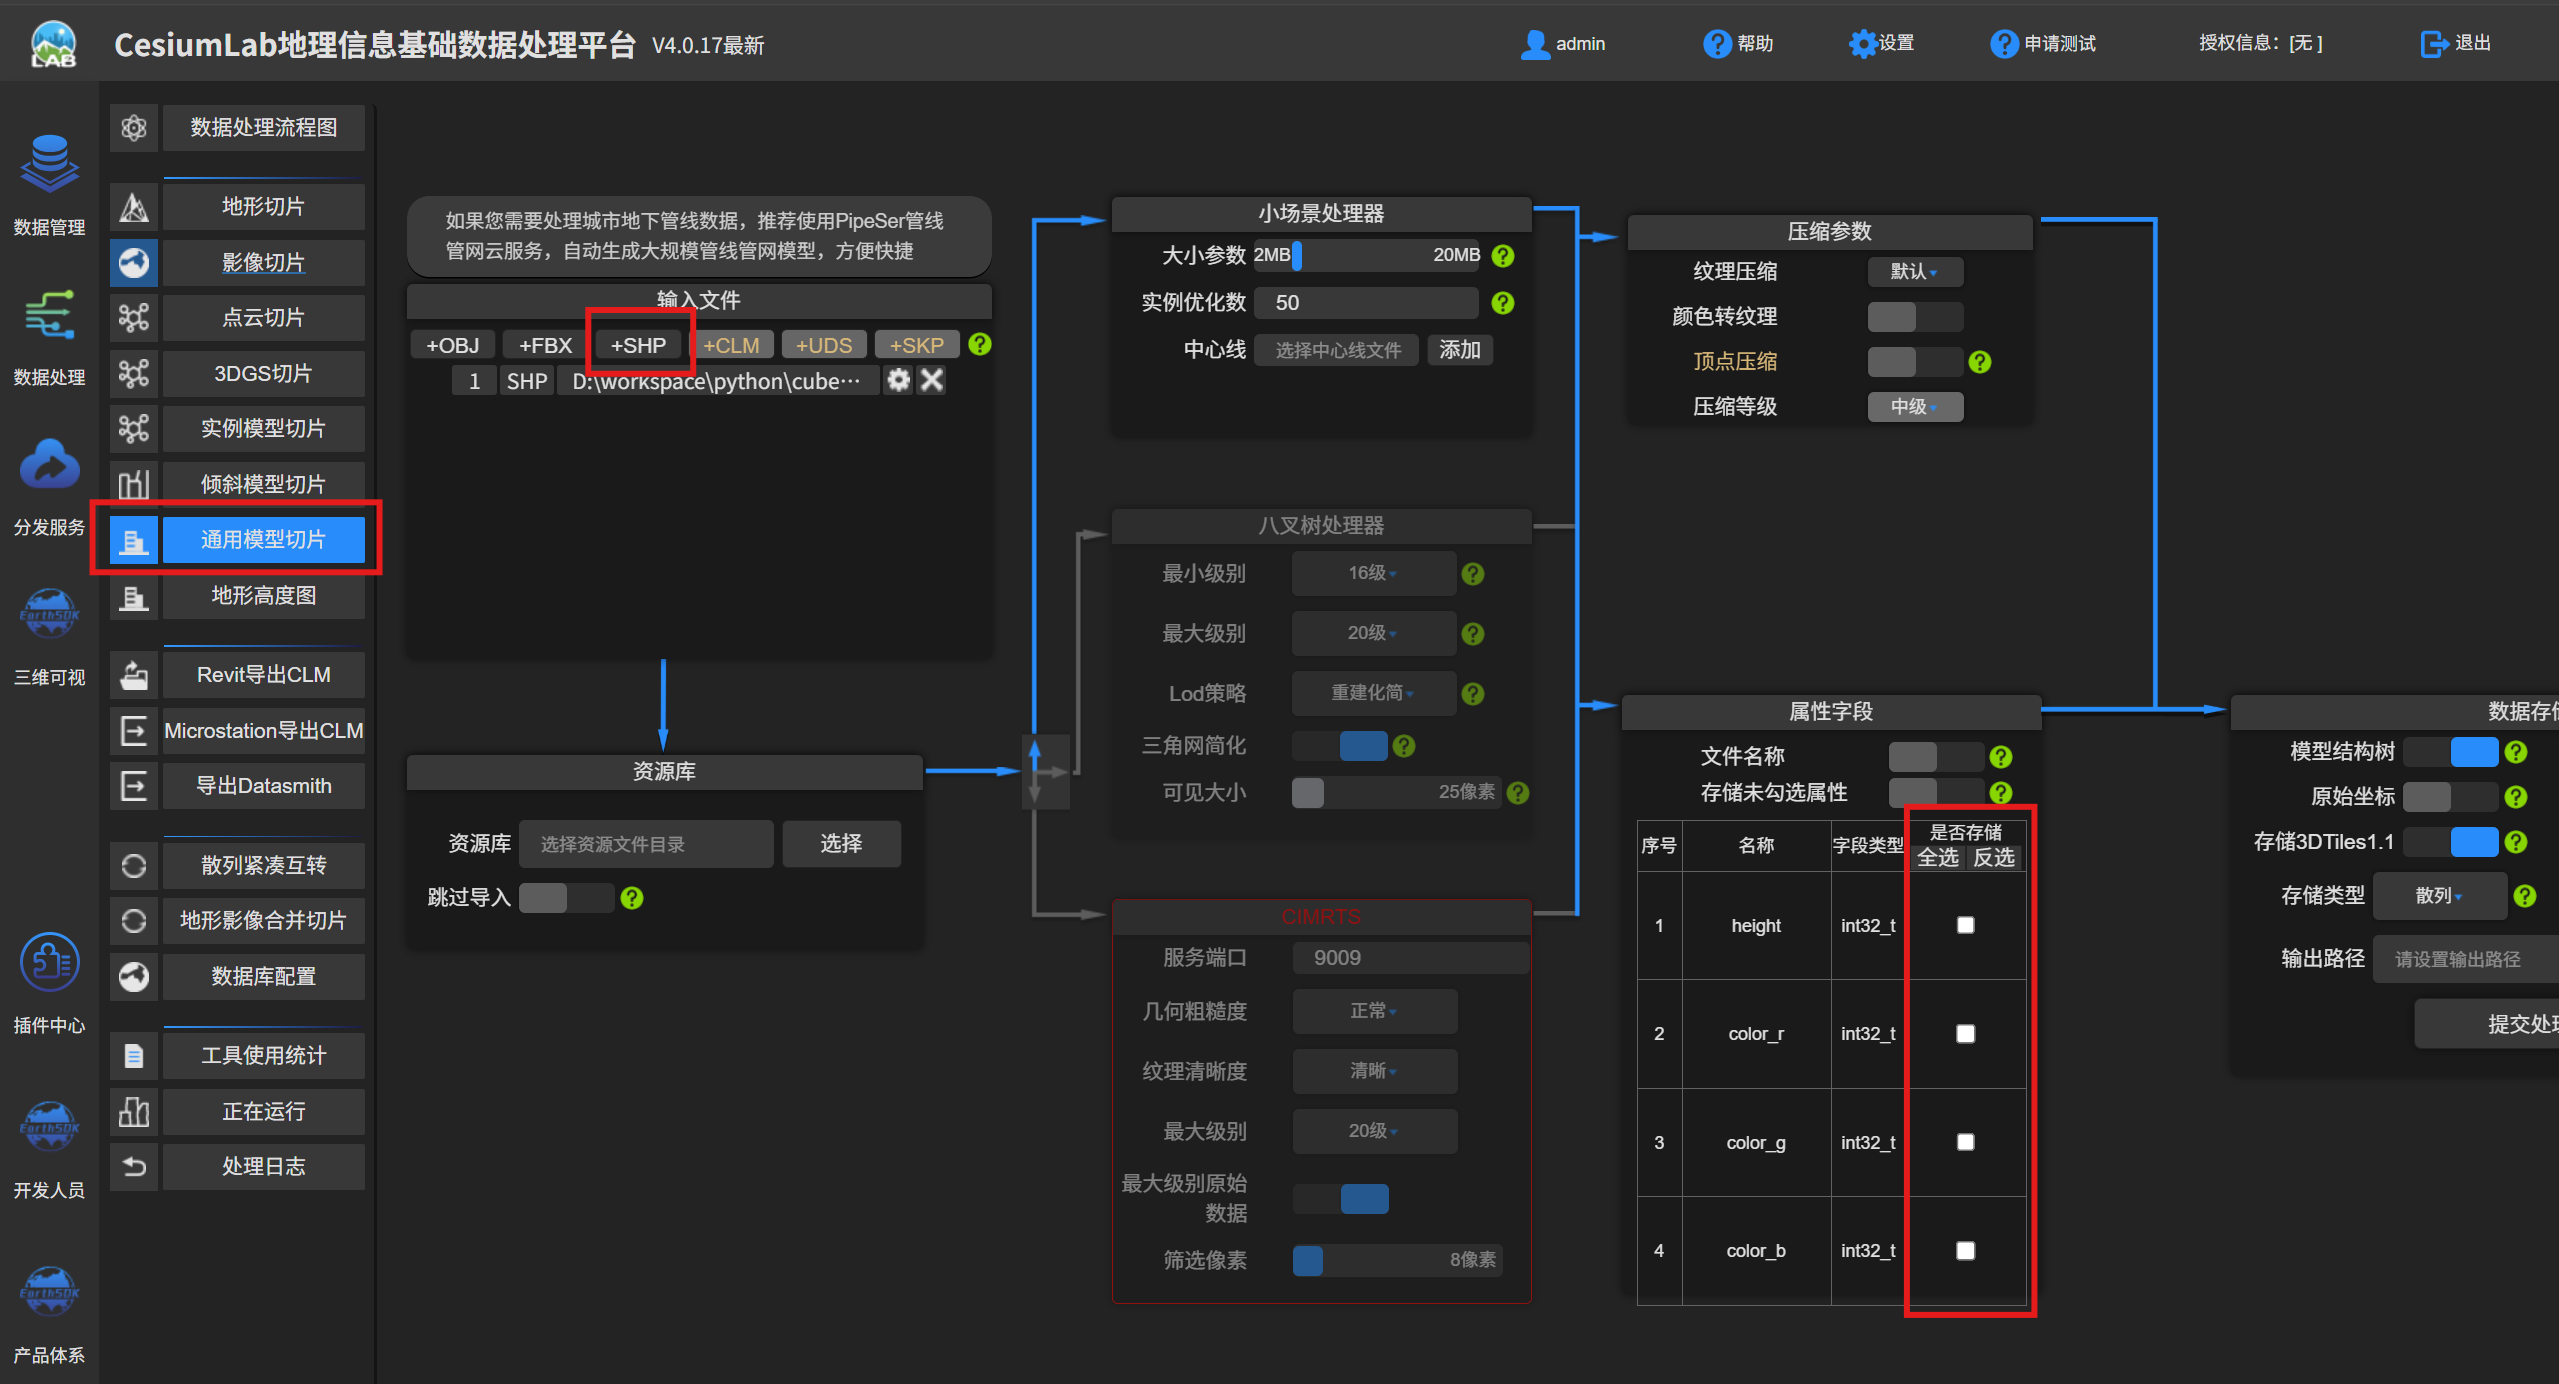
导入数据与模型切片
打开CesiumLab软件,在左侧菜单栏选择“数据处理”模块,点击“通用模型切片”(部分版本或场景下也称为“矢量楼块切片”)。在输入文件选项中,点击“+SHP”导入准备好的矢量数据文件。
3、Cesium中加载3d-tiles并设置颜色
<!doctype html>
<html lang="zh-CN">
  <head>
    <meta charset="UTF-8" />
    <meta name="viewport" content="width=device-width, initial-scale=1.0" />
    <title>Cesium GeoJSON 线要素加载示例</title>
    <!-- 引入 Cesium 库(这里使用官方 CDN,你也可以替换为本地路径) -->
    <script src="https://unpkg.com/cesium@1.138.0/Build/Cesium/Cesium.js"></script>
    <link
      href="https://unpkg.com/cesium@1.138.0/Build/Cesium/Widgets/widgets.css"
      rel="stylesheet"
    />
    <style>
      html,
      body,
      #cesiumContainer {
        width: 100%;
        height: 100%;
        margin: 0;
        padding: 0;
        overflow: hidden;
      }

      .cesium-point-cloud {
        pointsize: 10px !important;
      }
    </style>
  </head>

  <body>
    <div id="cesiumContainer"></div>

    <script type="module">
      // 1. 初始化 Cesium 地图(替换 MFmap 为原生 Cesium 初始化)
      Cesium.Ion.defaultAccessToken =
        "defaultAccessToken"; // 替换为你的 Token,可从 Cesium 官网获取
      const viewer = new Cesium.Viewer("cesiumContainer", {
        // geocoder: false,
        // timeline: false,
        // animation: false,
        // baseLayerPicker: false,
        // fullscreenButton: false,
        // vrButton: false,
        // homeButton: false,
        // infoBox: false,
        // selectionIndicator: false,
        // navigationHelpButton: false,
        // sceneModePicker: false,
        // imageryProvider: false
      });

      // // 添加到地图
      // viewer.imageryLayers.addImageryProvider(gaodeImagery);

      // 定义异步加载函数
      async function loadLocalTileset() {
        try {
          // 拼接本地服务器URL
          // 注意:端口号需与你启动的服务器端口一致
          const url = "./3DTILES/cube/tileset.json";

          // 调用最新的 fromUrl 方法
          const tileset = await Cesium.Cesium3DTileset.fromUrl(url, {
            maximumScreenSpaceError: 0.5, // 强制最高精度
            skipLevelOfDetail: true, // 强制加载所有点
            dynamicScreenSpaceError: false, // 关闭自动隐藏
            cullRequestsWhileMoving: false, // 移动时不卸载
            cullWithChildrenBounds: false,
          });

          tileset.style = new Cesium.Cesium3DTileStyle({
            color: {
              conditions: [
                // 读取属性表中的 RGB 字段并应用颜色
                [
                  "true",
                  "rgba(${feature['color_r']}, ${feature['color_g']}, ${feature['color_b']}, 1.0)",
                ],
              ],
            },
          });

          // 添加到场景
          viewer.scene.primitives.add(tileset);

          // 调试:等待tileset加载完成后查看位置
          console.log("Tileset边界球中心:", tileset.boundingSphere.center);
          console.log("边界球半径:", tileset.boundingSphere.radius);

          // 尝试创建一个红色标记点来辅助定位
          const centerPoint = viewer.entities.add({
            position: tileset.boundingSphere.center,
            point: {
              color: Cesium.Color.RED,
              pixelSize: 10,
            },
          });

          // 尝试将相机移动到tileset位置
          viewer.camera.flyTo({
            destination: Cesium.Cartesian3.fromDegrees(
              116.403874,
              39.914885,
              300,
            ),
            orientation: {
              heading: 0,
              pitch: Cesium.Math.toRadians(-60),
              roll: 0,
            },
            duration: 1,
          });
        } catch (error) {
          console.error("加载失败:", error);
        }
      }

      loadLocalTileset();
    </script>
  </body>
</html>
三、Mapbox中加载3d-tiles
<template>
  <div ref="mapBox" class="map-box"></div>
</template>

<script setup>
import { ref, onMounted, onUnmounted } from "vue";
import mapboxgl from "mapbox-gl";
import "mapbox-gl/dist/mapbox-gl.css";

import MapboxDraw from "@mapbox/mapbox-gl-draw";
import "@mapbox/mapbox-gl-draw/dist/mapbox-gl-draw.css";
import { MapboxOverlay } from "@deck.gl/mapbox";
import { Tile3DLayer } from "@deck.gl/geo-layers";
import { Tiles3DLoader } from "@loaders.gl/3d-tiles";

// mapboxgl.accessToken = "YOUR_MAPBOX_TOKEN";

const mapBox = ref(null);
let map = null;
let draw = null;

onMounted(() => {
  mapboxgl.accessToken =
    "accessToken";
  map = new mapboxgl.Map({
    container: mapBox.value,
    center: [116.4, 39.9], // 初始中心点(北京经纬度)
    zoom: 5, // 初始缩放级别
    minZoom: 0, // 最小层级(对应 Cesium 的 minimumLevel)
    maxZoom: 18, // 最大层级(对应 Cesium 的 maximumLevel)
  });

  map.on("load", async () => {
    const overlay = new MapboxOverlay({
      interleaved: true,
      layers: [
        new Tile3DLayer({
          id: "cesium-3dtiles",
          data: "/3dtiles/shp/tileset.json",
          loader: Tiles3DLoader,
          getPointColor: [255, 255, 0, 255],
          onTilesetLoad: (ts) => {
            const { cartographicCenter, zoom } = ts;
            map.jumpTo({
              center: cartographicCenter,
              zoom,
            });
          },
        }),
      ],
    });

    map.addControl(overlay);
  });

  map.on("style.load", () => {
    // Draw 可作为 Control 直接添加
    draw = new MapboxDraw({
      displayControlsDefault: false,
      controls: {
        polygon: true,
        line_string: true,
        point: true,
        trash: true,
      },
    });
    map.addControl(draw, "top-right");

    // 监听绘制事件
    map.on("draw.create", (e) => {
      console.log("create", draw.getAll());
    });
    map.on("draw.update", (e) => {
      console.log("update", draw.getAll());
    });
    map.on("draw.delete", (e) => {
      console.log("delete", draw.getAll());
    });
  });
});

onUnmounted(() => {
  if (map) {
    map.remove();
    map = null;
  }
});
</script>

<style>
.map-box {
  width: 100%;
  height: 100vh;
}
</style>

AtomGit 是由开放原子开源基金会联合 CSDN 等生态伙伴共同推出的新一代开源与人工智能协作平台。平台坚持“开放、中立、公益”的理念,把代码托管、模型共享、数据集托管、智能体开发体验和算力服务整合在一起,为开发者提供从开发、训练到部署的一站式体验。
更多推荐



 0
0 0
0- 0


 已为社区贡献1条内容

所有评论(0)