How to view active connections in MySQL or MariaDB
Checking live sessions on a MySQL or MariaDB server is one of the fastest ways to explain connection storms, lock pileups, slow application pools, and sudden 1040 Too many connections failures before they spread into a wider outage.
Each client session maps to a server thread, and SHOW FULL PROCESSLIST is the quickest interactive snapshot of what those threads are doing. On current MySQL releases, Oracle recommends the performance_schema.processlist table instead of the deprecated INFORMATION_SCHEMA.PROCESSLIST source, while MariaDB continues to expose both SHOW PROCESSLIST and information_schema.PROCESSLIST for the same job.
Seeing every session requires the PROCESS privilege; otherwise the server shows only the current account’s own threads. The Info column can expose full SQL text, and Threads_connected counts client sessions rather than internal daemon threads such as event_scheduler, so read both the process list and the status counters together.
Related: How to terminate an active user connection in MySQL or MariaDB
Related: How to limit active connections in MySQL or MariaDB
Steps to view active connections in MySQL or MariaDB:
- Open the mysql or mariadb client as an account allowed to inspect server activity.
$ mysql --user=root --password
Enter password:
Welcome to the MySQL monitor.  Commands end with ; or \g.
Your MySQL connection id is 31
Server version: 8.4.8 MySQL Community Server - GPL
##### snipped #####
mysql>
On local socket-auth installs, sudo mysql or sudo mariadb can open an administrative session without a password prompt.
- Display the full process list to see every visible session and what each one is doing right now.
mysql> SHOW FULL PROCESSLIST;
+----+-----------------+-----------------+------+---------+------+------------------------+-----------------------+
| Id | User            | Host            | db   | Command | Time | State                  | Info                  |
+----+-----------------+-----------------+------+---------+------+------------------------+-----------------------+
|  5 | event_scheduler | localhost       | NULL | Daemon  |  286 | Waiting on empty queue | NULL                  |
| 21 | app_user        | 127.0.0.1:47610 | NULL | Query   |  152 | User sleep             | SELECT SLEEP(300)     |
| 25 | report_user     | 127.0.0.1:39830 | NULL | Query   |  134 | User sleep             | SELECT SLEEP(300)     |
| 31 | root            | localhost       | NULL | Query   |    0 | init                   | SHOW FULL PROCESSLIST |
+----+-----------------+-----------------+------+---------+------+------------------------+-----------------------+
4 rows in set (0.00 sec)
Without the PROCESS privilege, MySQL or MariaDB hides other users’ sessions and shows only the current account’s own threads.
- Show the same data in vertical format when the Info or State columns are hard to read in a wide table.
mysql> SHOW FULL PROCESSLIST\G
*************************** 1. row ***************************
     Id: 5
   User: event_scheduler
   Host: localhost
     db: NULL
Command: Daemon
   Time: 286
  State: Waiting on empty queue
   Info: NULL
*************************** 2. row ***************************
     Id: 21
   User: app_user
   Host: 127.0.0.1:47610
     db: NULL
Command: Query
   Time: 152
  State: User sleep
   Info: SELECT SLEEP(300)
*************************** 3. row ***************************
     Id: 25
   User: report_user
   Host: 127.0.0.1:39830
     db: NULL
Command: Query
   Time: 134
  State: User sleep
   Info: SELECT SLEEP(300)
*************************** 4. row ***************************
     Id: 31
   User: root
   Host: localhost
     db: NULL
Command: Query
   Time: 0
  State: init
   Info: SHOW FULL PROCESSLIST
4 rows in set (0.00 sec)
Without FULL, the Info column is truncated to the first 100 characters.
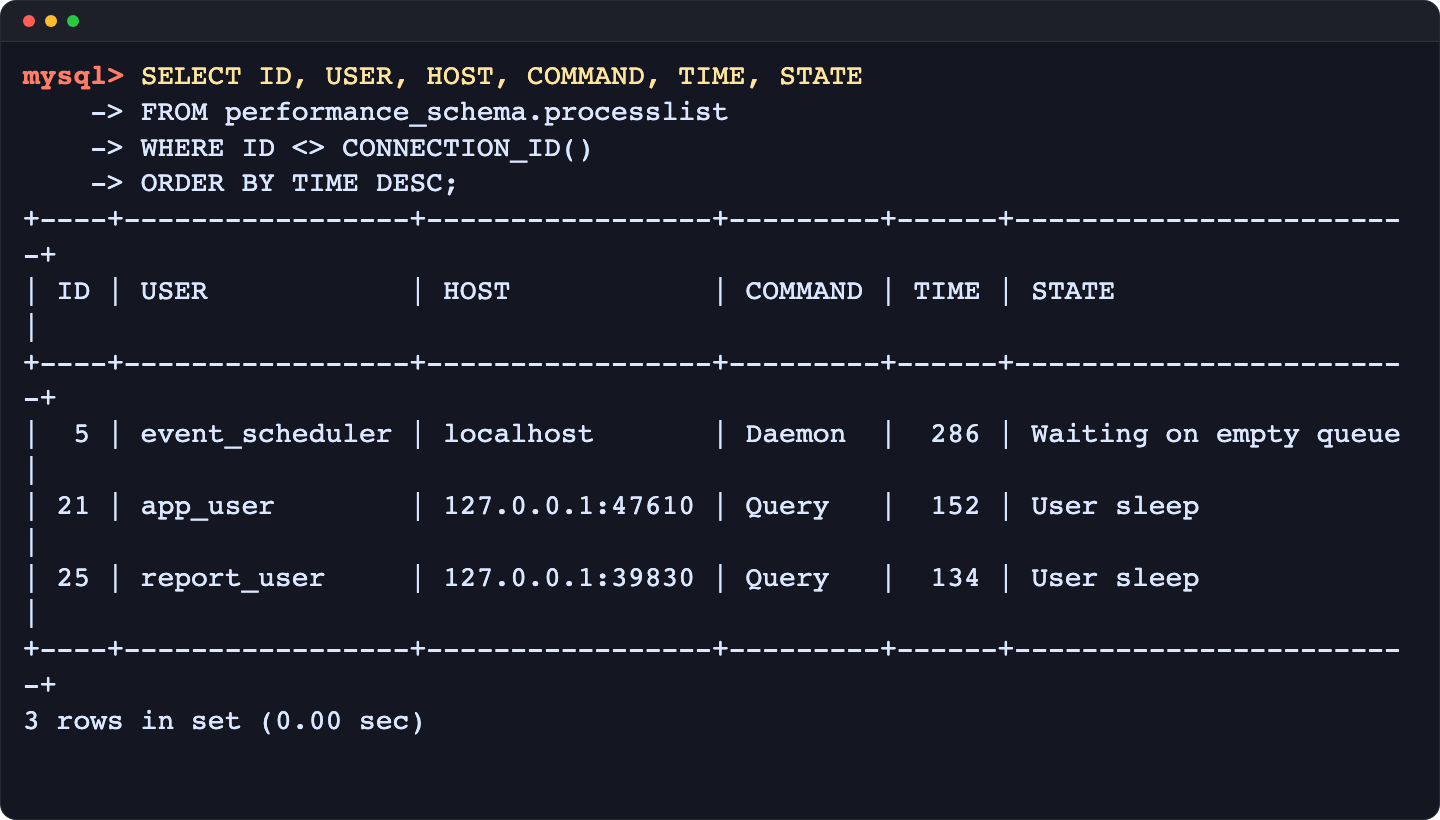
- Query performance_schema.processlist on current MySQL releases when you need SQL filtering, sorting, or aggregation without relying on the deprecated INFORMATION_SCHEMA.PROCESSLIST table.
mysql> SELECT ID, USER, HOST, DB, COMMAND, TIME, STATE, LEFT(INFO, 120) AS INFO
    -> FROM performance_schema.processlist
    -> WHERE ID <> CONNECTION_ID()
    -> ORDER BY TIME DESC;
+----+-----------------+-----------------+------+---------+------+------------------------+-------------------+
| ID | USER            | HOST            | DB   | COMMAND | TIME | STATE                  | INFO              |
+----+-----------------+-----------------+------+---------+------+------------------------+-------------------+
|  5 | event_scheduler | localhost       | NULL | Daemon  |  286 | Waiting on empty queue | NULL              |
| 21 | app_user        | 127.0.0.1:47610 | NULL | Query   |  152 | User sleep             | SELECT SLEEP(300) |
| 25 | report_user     | 127.0.0.1:39830 | NULL | Query   |  134 | User sleep             | SELECT SLEEP(300) |
+----+-----------------+-----------------+------+---------+------+------------------------+-------------------+
3 rows in set (0.00 sec)
On MySQL 8.4, querying INFORMATION_SCHEMA.PROCESSLIST still works but returns deprecation warning 1287. If the sys schema is installed, sys.processlist exposes the same sessions with helper columns such as statement latency and program name.
- Query information_schema.PROCESSLIST on MariaDB when you want SQL filtering plus MariaDB-specific columns such as TIME_MS, PROGRESS, or QUERY_ID.
MariaDB [(none)]> SELECT ID, USER, HOST, DB, COMMAND, TIME, STATE, LEFT(INFO, 120) AS INFO, PROGRESS
    -> FROM information_schema.PROCESSLIST
    -> WHERE ID <> CONNECTION_ID()
    -> ORDER BY TIME DESC;
+----+------+-----------+------+---------+------+------------+-------------------+----------+
| ID | USER | HOST      | DB   | COMMAND | TIME | STATE      | INFO              | PROGRESS |
+----+------+-----------+------+---------+------+------------+-------------------+----------+
|  5 | root | localhost | NULL | Query   |  275 | User sleep | SELECT SLEEP(300) |    0.000 |
|  4 | root | localhost | NULL | Query   |  275 | User sleep | SELECT SLEEP(300) |    0.000 |
+----+------+-----------+------+---------+------+------------+-------------------+----------+
2 rows in set (0.00 sec)
MariaDB also adds a Progress column to SHOW PROCESSLIST output, so long-running stages are easier to spot at a glance.
- Count current client sessions with the Threads_connected status variable.
mysql> SHOW GLOBAL STATUS LIKE 'Threads_connected';
+-------------------+-------+
| Variable_name     | Value |
+-------------------+-------+
| Threads_connected | 3     |
+-------------------+-------+
1 row in set (0.00 sec)
Threads_connected includes the current client session but excludes internal daemon threads such as event_scheduler.
- Summarize connections by user and client host to spot noisy pools or a single hot client quickly.
mysql> SELECT USER,
    ->        SUBSTRING_INDEX(HOST, ':', 1) AS host,
    ->        COUNT(*) AS connections
    -> FROM performance_schema.processlist
    -> GROUP BY USER, host
    -> ORDER BY connections DESC, USER, host;
+-----------------+-----------+-------------+
| USER            | host      | connections |
+-----------------+-----------+-------------+
| app_user        | 127.0.0.1 |           1 |
| event_scheduler | localhost |           1 |
| report_user     | 127.0.0.1 |           1 |
| root            | localhost |           1 |
+-----------------+-----------+-------------+
4 rows in set (0.00 sec)
On MariaDB, run the same aggregation against information_schema.PROCESSLIST and discount internal threads or your own admin session when comparing with application pool metrics.
- Inspect the configured connection cap when you need to judge whether the server is close to refusing new sessions.
mysql> SHOW VARIABLES LIKE 'max_connections';
+-----------------+-------+
| Variable_name   | Value |
+-----------------+-------+
| max_connections | 151   |
+-----------------+-------+
1 row in set (0.00 sec)
When the cap is reached, new sessions fail with 1040 Too many connections until another client disconnects.
- Check the historical peak to see how close the server has come to that cap since the last restart.
mysql> SHOW GLOBAL STATUS LIKE 'Max_used_connections';
+----------------------+-------+
| Variable_name        | Value |
+----------------------+-------+
| Max_used_connections | 4     |
+----------------------+-------+
1 row in set (0.00 sec)
A Max_used_connections value climbing toward max_connections usually points to undersized pools, leaked sessions, or a bursty client.
- Exit the client when you are finished reviewing live sessions.
mysql> exit
Bye

AtomGit 是由开放原子开源基金会联合 CSDN 等生态伙伴共同推出的新一代开源与人工智能协作平台。平台坚持“开放、中立、公益”的理念,把代码托管、模型共享、数据集托管、智能体开发体验和算力服务整合在一起,为开发者提供从开发、训练到部署的一站式体验。
更多推荐


 2
2 0
0- 0


 已为社区贡献38条内容

所有评论(0)