零基础教会你如何Vue3 中使用 ECharts (附源码)
·
前言
ECharts 是一个由百度开源的数据可视化库,它提供了丰富的图表类型和灵活的配置选项。在 Vue3 项目中集成 ECharts 可以帮助我们轻松实现各种数据可视化需求。本文将详细介绍如何在 Vue3 项目中使用 ECharts。
一、环境准备
1. 创建 Vue3 项目
如果你还没有 Vue3 项目,可以快速创建一个:
npm init vue@latest2. 安装 ECharts
进入项目目录并安装 ECharts:
cd demo
npm install echarts --save
二、基本使用
1. 全局引入 ECharts
在 main.js 或 main.ts 中全局引入 ECharts:
import './assets/main.css'

import { createApp } from 'vue'
import App from './App.vue'
import router from './router'
import * as echarts from 'echarts'
const app = createApp(App)

app.config.globalProperties.$echarts = echarts

app.use(router)

app.mount('#app')
2. 在组件中使用
创建一个基础图表组件 HomeView.vue:
<template>
  <!-- 图表容器:设置宽度和高度 -->
  <div ref="chartRef" style="width: 600px; height: 400px;"></div>
</template>

<script setup>
// 引入 Vue 的 Composition API
import { ref, onMounted, onBeforeUnmount } from 'vue'
// 引入 echarts 库
import * as echarts from 'echarts'

// 获取 DOM 元素的引用(用于初始化图表)
const chartRef = ref(null)
// 存储 ECharts 实例
let chartInstance = null

// 初始化图表的方法
const initChart = () => {
  if (chartRef.value) {
    // 初始化 echarts 实例
    chartInstance = echarts.init(chartRef.value)

    // 配置项
    const option = {
      title: {
        text: 'Vue3 中使用 ECharts' // 图表标题
      },
      tooltip: {}, // 默认提示框配置
      legend: {
        data: ['销量'] // 图例名称
      },
      xAxis: {
        data: ['衬衫', '羊毛衫', '雪纺衫', '裤子', '高跟鞋', '袜子'] // X 轴数据
      },
      yAxis: {}, // Y 轴默认配置
      series: [
        {
          name: '销量', // 系列名称
          type: 'bar', // 图表类型为柱状图
          data: [5, 20, 36, 10, 10, 20] // 数据值
        }
      ]
    }

    // 使用配置项渲染图表
    chartInstance.setOption(option)
  }
}

// 窗口大小变化时调整图表尺寸
const resizeChart = () => {
  chartInstance?.resize()
}

// 组件挂载后执行初始化
onMounted(() => {
  initChart()
  // 监听窗口大小变化事件以支持响应式
  window.addEventListener('resize', resizeChart)
})

// 组件卸载前清理资源,防止内存泄漏
onBeforeUnmount(() => {
  window.removeEventListener('resize', resizeChart)
  chartInstance?.dispose() // 销毁 echarts 实例
})
</script>
查看效果
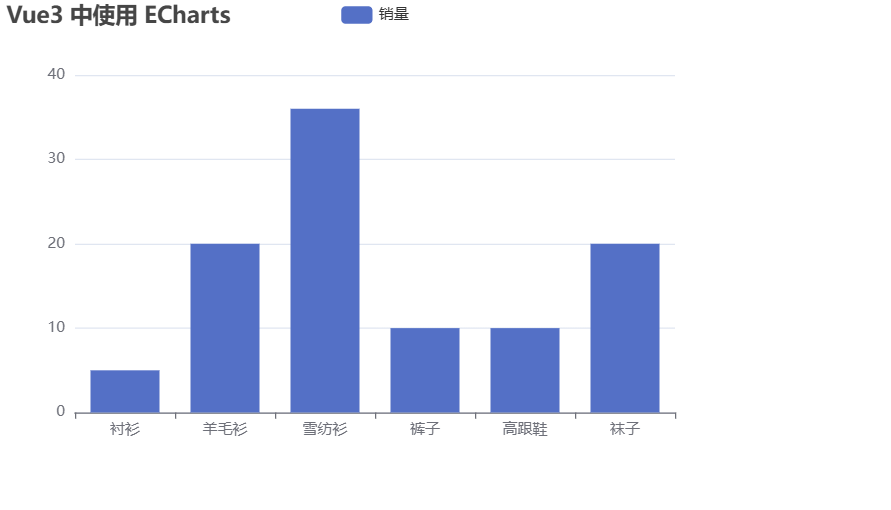
3.其他配置和效果案例可以参考Echarts官网 Examples - Apache ECharts
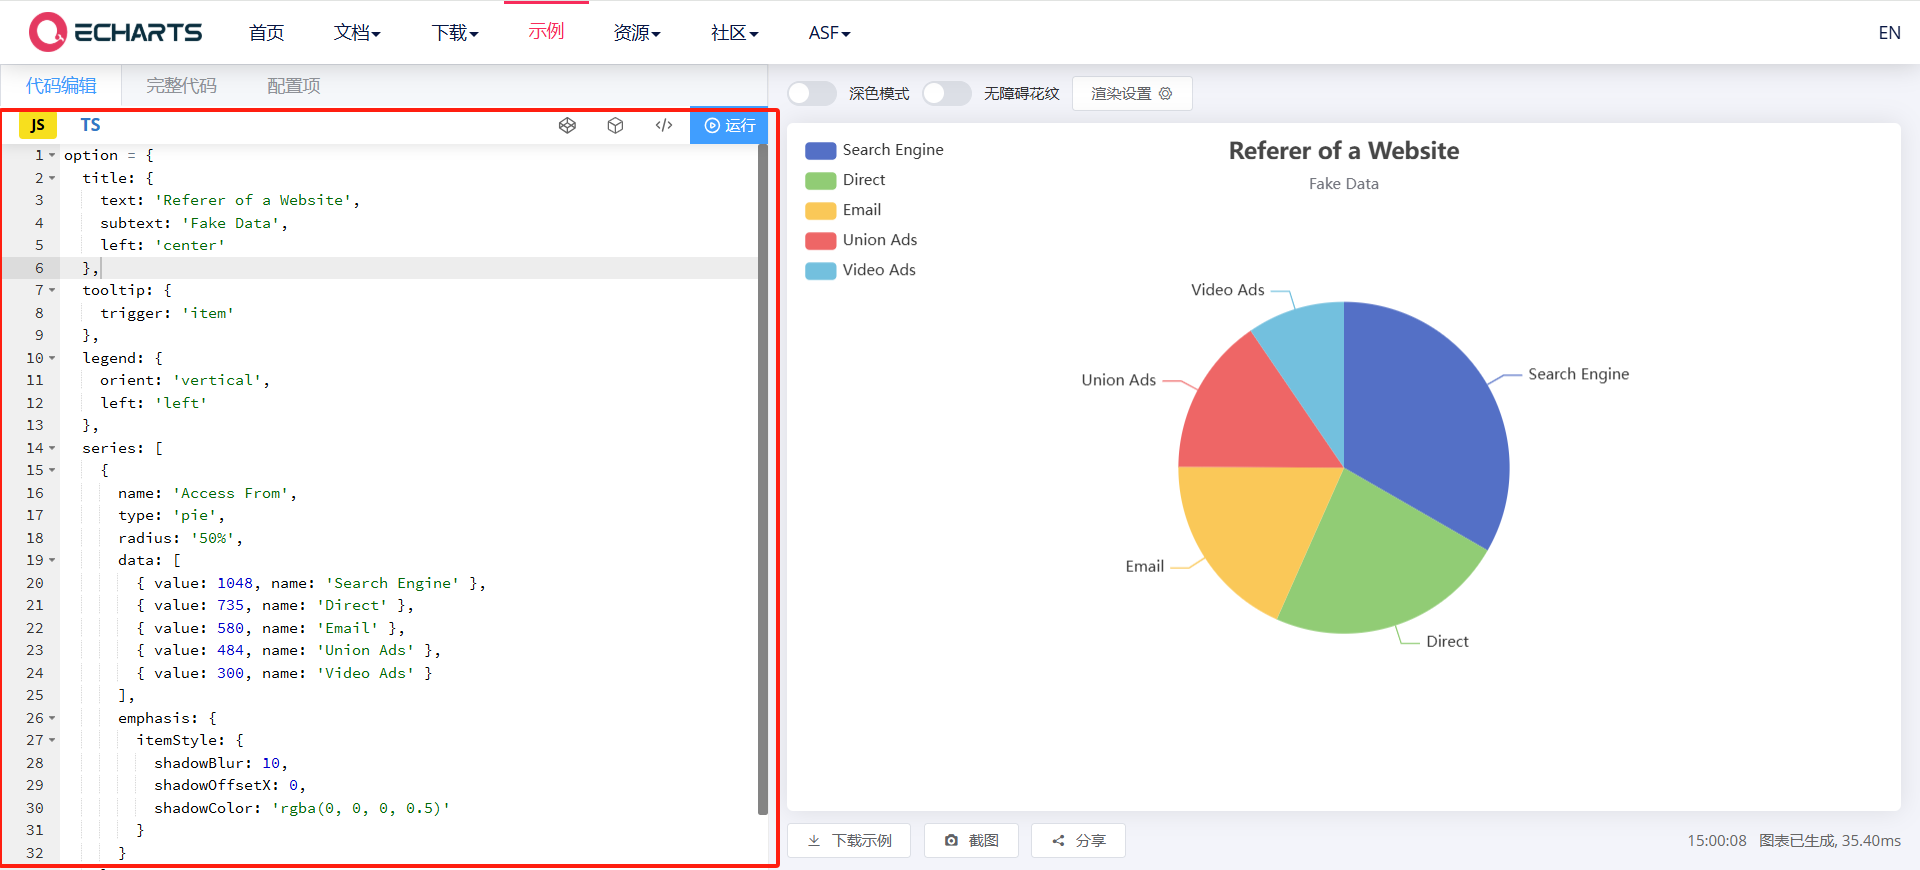
直接复制左边的代码
三、高级用法
1. 按需引入
为了减小打包体积,可以按需引入 ECharts 的模块:
<template>
  <!-- 图表容器 -->
  <div ref="chartRef" style="width: 600px; height: 400px;"></div>
</template>

<script setup>
import { ref, onMounted, onBeforeUnmount } from 'vue'

// 按需引入 echarts 核心模块
import * as echarts from 'echarts/core'
import { BarChart } from 'echarts/charts'
import {
  TitleComponent,
  TooltipComponent,
  GridComponent,
  LegendComponent
} from 'echarts/components'
import { CanvasRenderer } from 'echarts/renderers'

// 注册所需组件和图表类型
echarts.use([
  TitleComponent,
  TooltipComponent,
  GridComponent,
  LegendComponent,
  BarChart,
  CanvasRenderer
])

// 获取 DOM 引用
const chartRef = ref(null)
let chartInstance = null

// 初始化图表
const initChart = () => {
  if (chartRef.value) {
    // 创建 echarts 实例
    chartInstance = echarts.init(chartRef.value)

    // 配置项
    const option = {
      title: {
        text: '按需引入的 ECharts 柱状图'
      },
      tooltip: {},
      legend: {
        data: ['销量']
      },
      xAxis: {
        data: ['衬衫', '羊毛衫', '雪纺衫', '裤子', '高跟鞋', '袜子']
      },
      yAxis: {},
      series: [
        {
          name: '销量',
          type: 'bar',
          data: [5, 20, 36, 10, 10, 20]
        }
      ]
    }

    // 渲染图表
    chartInstance.setOption(option)
  }
}

// 响应窗口大小变化
const resizeChart = () => {
  chartInstance?.resize()
}

// 生命周期:挂载时初始化图表
onMounted(() => {
  initChart()
  window.addEventListener('resize', resizeChart)
})

// 生命周期:卸载前清理资源
onBeforeUnmount(() => {
  window.removeEventListener('resize', resizeChart)
  chartInstance?.dispose()
})
</script>
2. 响应式图表
使用 ResizeObserver 实现更精确的响应式:
<template>
  <!-- 图表容器 -->
  <div ref="chartRef" style="width: 600px; height: 400px;"></div>
</template>

<script setup>
import { ref, onMounted, onBeforeUnmount } from 'vue'

// 按需引入 echarts 核心模块
import * as echarts from 'echarts/core'
import { BarChart } from 'echarts/charts'
import {
  TitleComponent,
  TooltipComponent,
  GridComponent,
  LegendComponent
} from 'echarts/components'
import { CanvasRenderer } from 'echarts/renderers'

// 注册所需组件和图表类型
echarts.use([
  TitleComponent,
  TooltipComponent,
  GridComponent,
  LegendComponent,
  BarChart,
  CanvasRenderer
])

// 获取 DOM 引用
const chartRef = ref(null)
let chartInstance = null
let resizeObserver = null

// 初始化图表
const initChart = () => {
  if (chartRef.value) {
    // 创建 echarts 实例
    chartInstance = echarts.init(chartRef.value)

    // 配置项
    const option = {
      title: {
        text: '按需引入的 ECharts 柱状图'
      },
      tooltip: {},
      legend: {
        data: ['销量']
      },
      xAxis: {
        data: ['衬衫', '羊毛衫', '雪纺衫', '裤子', '高跟鞋', '袜子']
      },
      yAxis: {},
      series: [
        {
          name: '销量',
          type: 'bar',
          data: [5, 20, 36, 10, 10, 20]
        }
      ]
    }

    // 渲染图表
    chartInstance.setOption(option)
  }
}

// 使用 ResizeObserver 监听图表容器尺寸变化
const setupResizeObserver = () => {
  if (chartRef.value) {
    resizeObserver = new ResizeObserver(() => {
      chartInstance?.resize()
    })

    resizeObserver.observe(chartRef.value)
  }
}

// 生命周期:挂载时初始化图表
onMounted(() => {
  initChart()
  setupResizeObserver()
})

// 生命周期:卸载前清理资源
onBeforeUnmount(() => {
  resizeObserver?.disconnect()
  chartInstance?.dispose()
})
</script>
四、常见问题
1. 图表不显示
-
确保容器有明确的宽度和高度
-
检查 DOM 元素是否已挂载后再初始化图表
-
确认 ECharts 已正确引入
2. 内存泄漏
-
在组件卸载时调用
dispose()方法 -
移除所有事件监听器
3. 响应式问题
-
使用
watch监听 option 变化 -
在窗口大小变化时调用
resize()方法
五、总结
本文介绍了在 Vue3 项目中集成 ECharts 的基本方法和高级技巧,包括:
-
基本图表创建
-
按需引入减小体积
-
响应式处理
-
封装可复用组件
-
常见问题解决
通过合理使用 ECharts,我们可以为 Vue3 项目添加丰富的数据可视化功能,提升用户体验。
附录

AtomGit 是由开放原子开源基金会联合 CSDN 等生态伙伴共同推出的新一代开源与人工智能协作平台。平台坚持“开放、中立、公益”的理念,把代码托管、模型共享、数据集托管、智能体开发体验和算力服务整合在一起,为开发者提供从开发、训练到部署的一站式体验。
更多推荐



 27
27 0
0- 0


 已为社区贡献1条内容

所有评论(0)