基因集大语言模型 GSFM,这个概念比常规的富集分析听起来可高大尚多了!
生信碱移
基因集基础模型
基因集基础模型 GSFM,实现基因功能预测、蛋白互作预测、基因集富集分析、疾病关联与药物挖掘等下游任务。
基础模型在生物领域可以说是这两年算是层出不穷。热门的领域都有相应的数据量积累了,比如说基因组、单细胞空转啥的,像 AlphaGenome/evo2/scoby/Borzoi 就是经典的基因组模型,而 Geneformer/scGPT/CellFM 啥的则是经典的单细胞基础模型。这些小编之前或多或少都有分享过,各位佬铁可以直接检索关键词阅读学习。
补充一下,基础模型最强悍的能力之一在于即使没有任何新的训练数据做微调,也能基于预训练中获得的信息完成新的任务。比如下面这张 Evo2 的正文结果图,可以看到作者设计的序列在实验测序中能够产生与预期一致的染色质可及性模式:
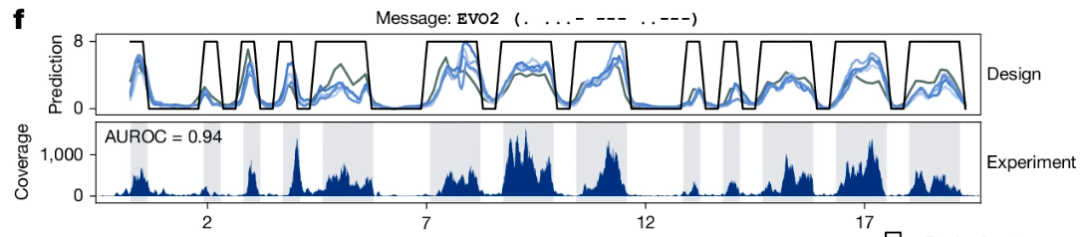
图:实验获得的模式(下)与设计(上)高度一致,AUROC 能达到 0.94。
今天看到一个今年5月21日刚刚见刊 Cell 子刊 Patterns 的基础模型 GSFM,模型侧重的角度还是比较新颖的,叫做基因集基础模型。没错,就是你理解的那个”基因集“的意思(不懂的同学可以自行问问ai),原文为”A gene set foundation model“。
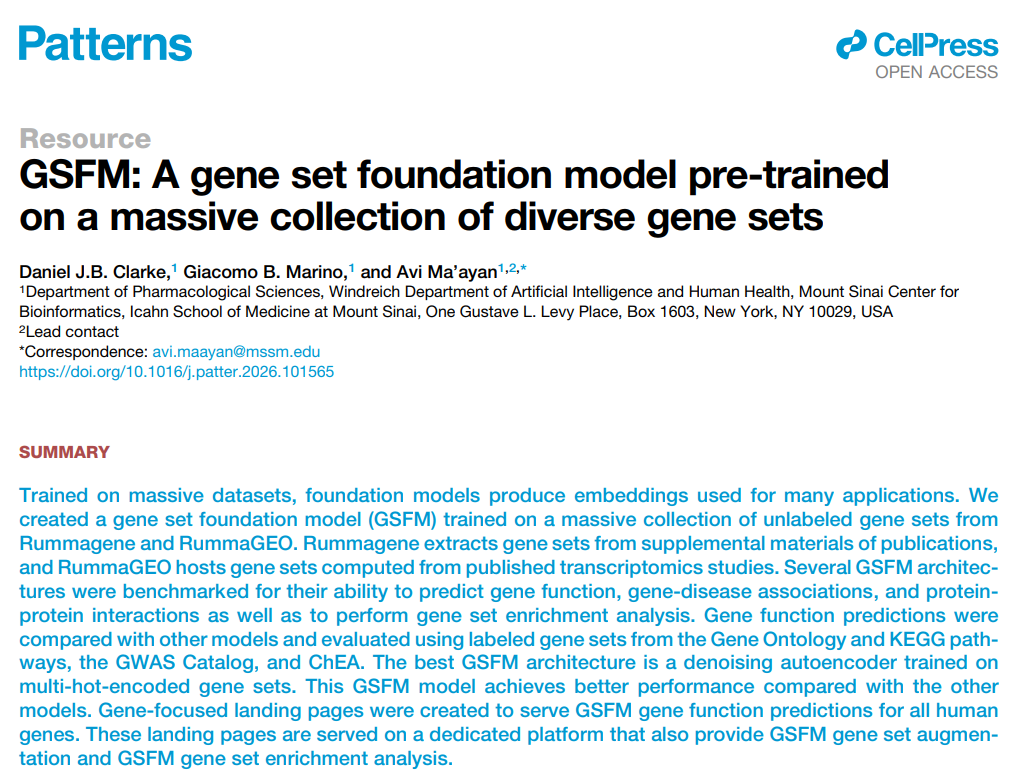
DOI: 10.1016/j.patter.2026.101565
作者使用的模型架构与训练策略也是比较常见的,重点在于训练的数据非常庞大,使用了超过 100 万条多样化基因集进行训练。训练的输入就是一个个的基因集,每个基因集以多热编码(multi-hot)形式表示,并通过自监督方式进行训练。
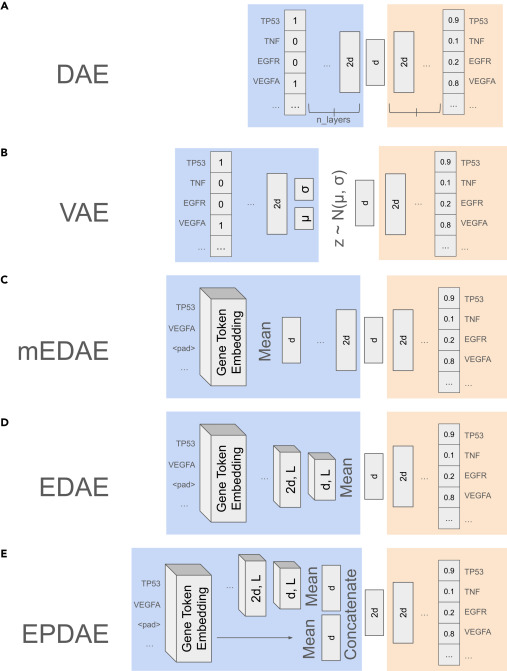
图:用于测试的模型架构,确时还是比较常规的模型了。
数据层面,作者使用了前期开发的工具 Rummagene 和 RummaGEO,分别搜集了大规模的基因集数据:
-
• Rummagene:从论文补充材料中提取的基因集(472601条)
-
• RummaGEO:通过RNA-seq差异表达计算生成的基因集(153964条)
好巧不巧,Rummagene 小编 24 年还分享过,当时感觉还蛮有用的,感兴趣的铁子可以点击阅读。
搞不懂也问题不大,其实应用层面就是高级一点的通路注释。属于是你做你的 KEGG/GO,我做我的基因集基础模型(那能一样吗)。用起来也比较简单,直接在下方网站搜索感兴趣的基因,即可返回功能排序结果,结果覆盖面从 KEGG/GO 延伸到了 GWAS、转录因子、疾病与药物靶点。
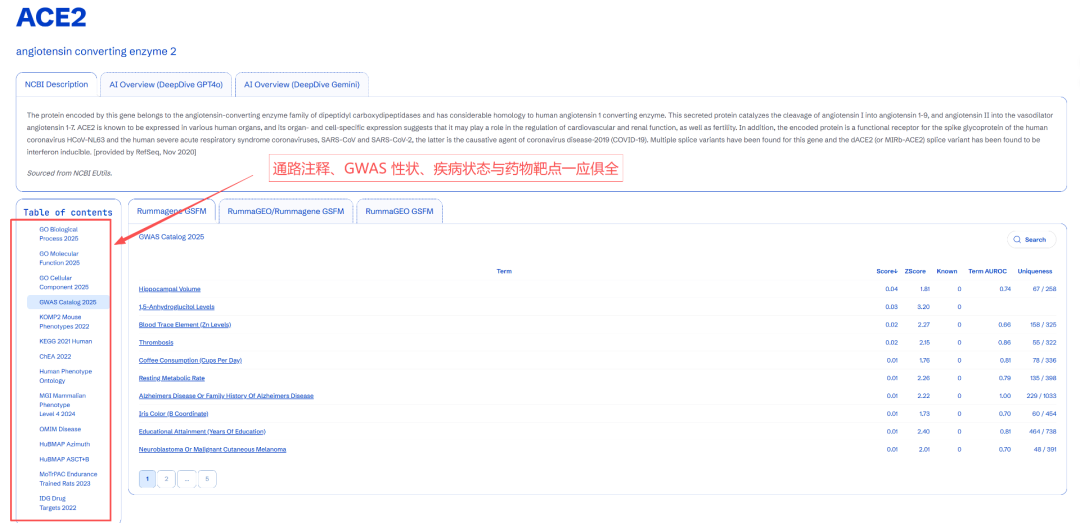
网站链接:https://gsfm.maayanlab.cloud/。可以看到下方的结果还是比较多的。
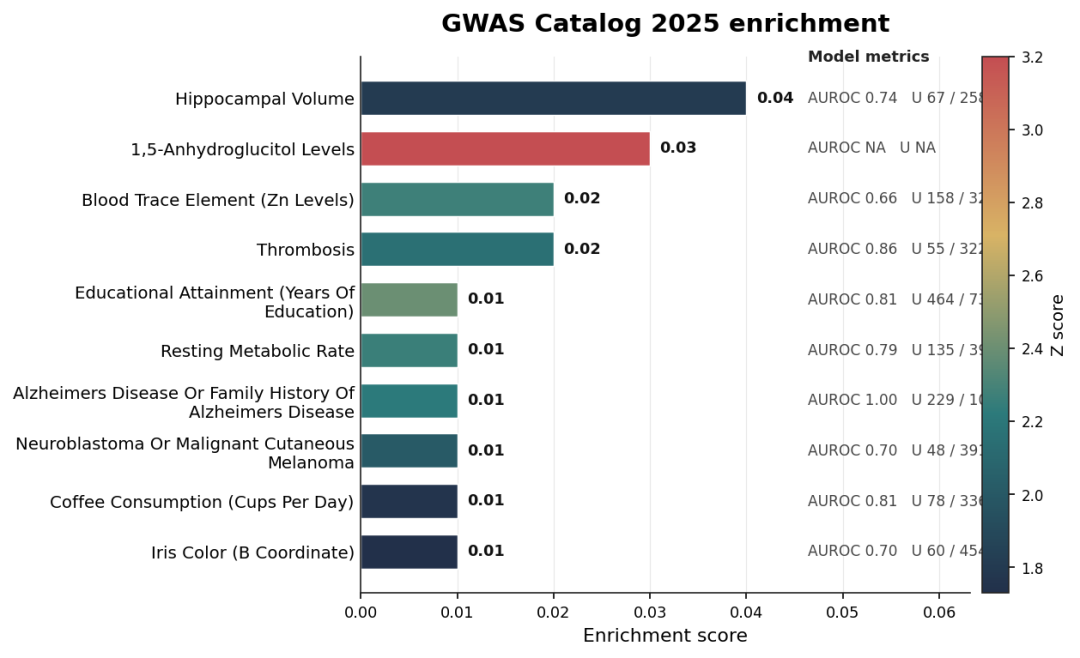
可惜就是缺少可视化功能,只能找个代码执行可视化一下了,下面展示一个 GWAS Catalog 的 ACE2 富集结果,效果还是不错的:
import pandas as pd
import numpy as np
import matplotlib.pyplot as plt
import matplotlib as mpl
from matplotlib.colors import LinearSegmentedColormap

# 把数据搞成字典,不过还是建议整理成表直接读入
data = {
    "Term": [
        "Hippocampal Volume",
        "1,5-Anhydroglucitol Levels",
        "Blood Trace Element (Zn Levels)",
        "Thrombosis",
        "Coffee Consumption (Cups Per Day)",
        "Resting Metabolic Rate",
        "Alzheimers Disease Or Family History Of Alzheimers Disease",
        "Iris Color (B Coordinate)",
        "Educational Attainment (Years Of Education)",
        "Neuroblastoma Or Malignant Cutaneous Melanoma"
    ],
    "Score": [0.04, 0.03, 0.02, 0.02, 0.01, 0.01, 0.01, 0.01, 0.01, 0.01],
    "ZScore": [1.81, 3.20, 2.27, 2.15, 1.76, 2.26, 2.22, 1.73, 2.40, 2.01],
    "Known": [0, 0, 0, 0, 0, 0, 0, 0, 0, 0],
    "AUROC": [0.74, np.nan, 0.66, 0.86, 0.81, 0.79, 1.00, 0.70, 0.81, 0.70],
    "Uniqueness": [
        "67 / 258",
        "",
        "158 / 325",
        "55 / 322",
        "78 / 336",
        "135 / 398",
        "229 / 1033",
        "60 / 454",
        "464 / 738",
        "48 / 391"
    ]
}

df = pd.DataFrame(data)

df = df.sort_values("Score", ascending=True)

plt.rcParams.update({
    "font.family": "Arial",
    "font.size": 10,
    "axes.linewidth": 0.8,
    "axes.edgecolor": "#222222",
    "xtick.major.width": 0.8,
    "ytick.major.width": 0.8,
    "pdf.fonttype": 42,
    "ps.fonttype": 42
})

nature_cmap = LinearSegmentedColormap.from_list(
    "nature_blue_green_gold",
    ["#264653", "#2A9D8F", "#E9C46A", "#E76F51"]
)

norm = mpl.colors.Normalize(
    vmin=df["ZScore"].min(),
    vmax=df["ZScore"].max()
)

colors = nature_cmap(norm(df["ZScore"]))

fig, ax = plt.subplots(figsize=(7.2, 4.8))

bars = ax.barh(
    df["Term"],
    df["Score"],
    color=colors,
    edgecolor="none",
    height=0.68
)

ax.set_xlim(0, df["Score"].max() * 1.48)

for i, (_, row) in enumerate(df.iterrows()):
    x = row["Score"]

    auroc_text = "NA" if pd.isna(row["AUROC"]) else f"{row['AUROC']:.2f}"
    uniq_text = row["Uniqueness"] if row["Uniqueness"] else "NA"

    label = f"AUROC {auroc_text}   Uniq. {uniq_text}"

    ax.text(
        x + df["Score"].max() * 0.025,
        i,
        label,
        va="center",
        ha="left",
        fontsize=8.5,
        color="#333333"
    )

ax.set_xlabel("Enrichment score", fontsize=11)
ax.set_ylabel("")
ax.set_title(
    "GWAS Catalog 2025 enrichment",
    fontsize=13,
    fontweight="bold",
    pad=12
)

ax.spines["top"].set_visible(False)
ax.spines["right"].set_visible(False)
ax.xaxis.grid(True, linestyle="-", linewidth=0.5, color="#E5E5E5")
ax.set_axisbelow(True)

def wrap_label(label, width=42):
    words = label.split()
    lines = []
    line = ""
    for w in words:
        if len(line + " " + w) <= width:
            line = (line + " " + w).strip()
        else:
            lines.append(line)
            line = w
    lines.append(line)
    return "\n".join(lines)

ax.set_yticklabels([wrap_label(t) for t in df["Term"]])

sm = mpl.cm.ScalarMappable(cmap=nature_cmap, norm=norm)
sm.set_array([])
cbar = fig.colorbar(
    sm,
    ax=ax,
    pad=0.02,
    fraction=0.045
)
cbar.set_label("Z score", fontsize=10)
cbar.ax.tick_params(labelsize=8)
for bar, score in zip(bars, df["Score"]):
    ax.text(
        bar.get_width() + df["Score"].max() * 0.005,
        bar.get_y() + bar.get_height() / 2,
        f"{score:.2f}",
        va="center",
        ha="left",
        fontsize=8.5,
        color="#111111",
        fontweight="bold"
    )
plt.tight_layout()
plt.show()
可以试试,概念层面怎么说也能有点提升吧。不过考虑自己训练一个基因集基础模型,或者有其它潜在的基础模型切入点也有搞头啊
简单分享,欢迎各位佬哥佬姐关注一手

AtomGit 是由开放原子开源基金会联合 CSDN 等生态伙伴共同推出的新一代开源与人工智能协作平台。平台坚持“开放、中立、公益”的理念,把代码托管、模型共享、数据集托管、智能体开发体验和算力服务整合在一起,为开发者提供从开发、训练到部署的一站式体验。
更多推荐


 8
8 0
0- 0


 已为社区贡献3条内容

所有评论(0)