Java 程序员第 42 阶段20:文档智能解析审核大模型实现合同摘要与合规校验,生产上线与持续迭代
──────────────────────────────────────────────────
目录
- [章节概述](#章节概述)
2. [生产环境验收测试清单](#生产环境验收测试清单)
3. [灰度发布与回滚策略](#灰度发布与回滚策略)
4. [Prometheus + Grafana监控告警配置](#prometheus-grafana监控告警配置)
5. [ELK日志收集与分析](#elk日志收集与分析)
6. [持续集成与持续部署](#持续集成与持续部署)
7. [章节总结](#章节总结)
──────────────────────────────────────────────────
章节概述
20.1 学习目标
本章节将深入讲解合同审核系统的生产上线与持续迭代技术栈,包括:
- 掌握生产环境验收测试清单制定与执行
- 熟练使用灰度发布与回滚策略降低发布风险
- 理解Prometheus + Grafana监控告警体系
- 掌握ELK日志收集与分析架构
- 熟练配置Jenkins/GitHub Actions持续部署流水线
20.2 章节背景
合同智能审核系统进入生产环境后,需要建立完善的:
- **质量保障体系**:多维度验收测试确保系统稳定
- **发布控制体系**:灰度发布降低风险,快速回滚保证可用
- **运维监控体系**:实时监控告警,快速定位问题
- **持续迭代体系**:自动化流水线提高交付效率
──────────────────────────────────────────────────
生产环境验收测试清单
20.2.1 功能验收测试
# 合同审核系统生产环境验收测试清单
## 一、功能验收测试
### 1.1 合同上传功能
- [ ] 支持PDF格式上传,单文件大小不超过100MB
- [ ] 支持Word(doc/docx)格式上传
- [ ] 支持图片格式(jpg/png)上传
- [ ] 大文件上传进度显示正常
- [ ] 上传失败时错误提示清晰
- [ ] 并发上传10个文件成功率100%
### 1.2 合同解析功能
- [ ] PDF解析完整率 > 99%
- [ ] 文字提取准确率 > 98%
- [ ] 表格结构识别正确
- [ ] 合同要素(甲方、乙方、金额、日期)提取准确
- [ ] 解析时间:单页PDF < 2秒
### 1.3 AI摘要生成
- [ ] 摘要长度控制在200-500字
- [ ] 摘要内容与原合同一致
- [ ] 关键条款不遗漏
- [ ] 生成时间 < 10秒
- [ ] 支持中英文合同
### 1.4 合规校验功能
- [ ] 风险条款识别准确率 > 95%
- [ ] 法规引用正确
- [ ] 校验建议实用可行
- [ ] 支持自定义校验规则
- [ ] 校验结果可导出
### 1.5 用户权限功能
- [ ] 用户注册/登录正常
- [ ] 角色权限配置生效
- [ ] 操作审计日志完整
- [ ] 单点登录(SSO)正常
- [ ] Token过期处理正确
20.2.2 性能验收测试
# 性能测试脚本 - 使用Apache Bench
# 并发测试
ab -n 1000 -c 100 http://contract-api.example.com/actuator/health
# 性能测试脚本 - 使用JMeter
# jmeter -n -t contract_api_test.jmx -l result.jtl
# 性能测试用例
echo "
========================================
性能验收测试标准
========================================
指标名称 标准值 测试方法
----------------------------------------
首页响应时间 < 1秒 10次平均
合同上传响应时间 < 3秒 10次平均
合同解析响应时间 < 5秒/页 10次平均
摘要生成响应时间 < 10秒 10次平均
并发用户数 > 100 成功率>99%
系统吞吐量 > 50 QPS 10分钟压测
CPU利用率 < 70% 峰值时
内存利用率 < 80% 峰值时
"
# 性能测试报告模板
performance_test_report:
test_info:
test_date: "2024-01-15"
test_environment: "生产环境"
test_tool: "Apache JMeter 5.6"
test_duration: "30分钟"
test_results:
concurrent_users:
scenario: "模拟100用户同时操作"
duration: 1800
total_requests: 45000
successful_requests: 44955
failed_requests: 45
success_rate: "99.90%"
avg_response_time: "1.2秒"
p95_response_time: "2.5秒"
p99_response_time: "4.1秒"
sustained_load:
scenario: "持续80%容量负载"
duration: 1800
avg_cpu: "55%"
avg_memory: "62%"
avg_qps: 85
error_rate: "0.05%"
conclusion: "通过性能验收"
20.2.3 安全验收测试
# 安全扫描命令
# 1. 依赖漏洞扫描
./mvnw org.owasp:dependency-check-maven-plugin:check
# 2. 代码安全扫描
./mvnw spotbugs:check
# 3. 容器镜像扫描
trivy image contract-api:1.0.0
# 4. Kubernetes集群安全扫描
kube-bench run --targets=master,node
# 安全测试用例
echo "
========================================
安全验收测试清单
========================================
[ ] SQL注入防护测试
- 输入: ' OR 1=1 --
- 预期: 请求被拒绝或参数转义
[ ] XSS攻击防护测试
- 输入: <script>alert('xss')</script>
- 预期: 脚本不被执行
[ ] CSRF令牌验证
- 预期: 无令牌请求被拒绝
[ ] 身份认证测试
- 预期: 错误密码5次后账户锁定
[ ] 敏感数据加密
- 预期: 数据库中密码为加密存储
[ ] HTTPS强制跳转
- 预期: HTTP请求自动跳转HTTPS
[ ] 敏感接口限流
- 预期: 超过限流返回429状态码
"
──────────────────────────────────────────────────
灰度发布与回滚策略
20.3.1 灰度发布流程
# canary-deployment.yaml
apiVersion: argoproj.io/v1alpha1
kind: Rollout
metadata:
name: contract-api
namespace: production
spec:
replicas: 10
strategy:
canary:
# 步进式灰度
steps:
- setWeight: 10
- pause: {duration: 10m}
- setWeight: 30
- pause: {duration: 10m}
- setWeight: 50
- pause: {duration: 10m}
- setWeight: 100
# 金丝雀分析
analysis:
templates:
- templateName: success-rate
args:
- name: service-name
value: contract-api-canary
# 自动回滚条件
canaryMetadata:
labels:
role: canary
stableMetadata:
labels:
role: stable
# 流量权重
trafficRouting:
nginx:
stableIngress: contract-api-stable
additionalIngressAnnotations:
canary-by-header: X-Canary
20.3.2 回滚策略配置
# rollback-strategy.yaml
apiVersion: flagger.app/v1beta1
kind: MetricTemplate
metadata:
name: success-rate
namespace: production
spec:
provider:
type: prometheus
address: http://prometheus.monitor:9090
query: |
histogram_quantile(0.99,
sum(rate(nginx_ingress_controller_request_duration_seconds_bucket{
ingress="{{.Name}}"
}[5m])) by (le)
)
---
apiVersion: flagger.app/v1beta1
kind: AlertProvider
metadata:
name: slack
namespace: production
spec:
type: slack
channel: "#contract-alerts"
webhook: https://hooks.slack.com/services/xxx
20.3.3 回滚操作命令
# ===================================================================
# 回滚操作指南
# ===================================================================
# 1. 查看部署历史
kubectl rollout history deployment/contract-api -n production
# 2. 查看特定版本的详细信息
kubectl rollout history deployment/contract-api -n production --revision=3
# 3. 回滚到上一个版本
kubectl rollout undo deployment/contract-api -n production
# 4. 回滚到指定版本
kubectl rollout undo deployment/contract-api -n production --to-revision=2
# 5. 查看回滚状态
kubectl rollout status deployment/contract-api -n production
# 6. 验证回滚后的Pod
kubectl get pods -n production -l app=contract-api
# 7. 测试回滚后的服务
curl http://contract-api.production.svc.cluster.local/actuator/health
# 8. 紧急回滚脚本
#!/bin/bash
echo "开始紧急回滚..."
kubectl rollout undo deployment/contract-api -n production
echo "等待回滚完成..."
kubectl rollout status deployment/contract-api -n production --timeout=300s
echo "验证服务状态..."
curl -f http://contract-api/actuator/health || exit 1
echo "回滚完成!"
──────────────────────────────────────────────────
Prometheus + Grafana监控告警配置
20.4.1 Prometheus配置
# prometheus-config.yaml
apiVersion: v1
kind: ConfigMap
metadata:
name: prometheus-config
namespace: monitor
data:
prometheus.yml: |
global:
scrape_interval: 15s
evaluation_interval: 15s
external_labels:
cluster: 'production'
env: 'prod'
alerting:
alertmanagers:
- static_configs:
- targets:
- alertmanager.monitor.svc.cluster.local:9093
rule_files:
- "/etc/prometheus/rules/*.yml"
scrape_configs:
# Prometheus自我监控
- job_name: 'prometheus'
static_configs:
- targets: ['localhost:9090']
# Kubernetes API Server
- job_name: 'kubernetes-apiservers'
kubernetes_sd_configs:
- role: endpoints
scheme: https
tls_config:
ca_file: /var/run/secrets/kubernetes.io/serviceaccount/ca.crt
bearer_token_file: /var/run/secrets/kubernetes.io/serviceaccount/token
relabel_configs:
- source_labels: [__meta_kubernetes_namespace, __meta_kubernetes_service_name, __meta_kubernetes_endpoint_port_name]
action: keep
regex: default;kubernetes;https
# Kubernetes Pods
- job_name: 'kubernetes-pods'
kubernetes_sd_configs:
- role: pod
relabel_configs:
- source_labels: [__meta_kubernetes_pod_annotation_prometheus_io_scrape]
action: keep
regex: true
- source_labels: [__meta_kubernetes_pod_annotation_prometheus_io_path]
action: replace
target_label: __metrics_path__
regex: (.+)
- source_labels: [__address__, __meta_kubernetes_pod_annotation_prometheus_io_port]
action: replace
regex: ([^:]+)(?::\d+)?;(\d+)
replacement: $1:$2
target_label: __address__
- action: labelmap
regex: __meta_kubernetes_pod_label_(.+)
# Contract API应用
- job_name: 'contract-api'
kubernetes_sd_configs:
- role: service
relabel_configs:
- source_labels: [__meta_kubernetes_service_label_app]
action: keep
regex: contract-api
- source_labels: [__meta_kubernetes_service_label_monitor]
action: keep
regex: enabled
- action: labelmap
regex: __meta_kubernetes_service_label_(.+)
20.4.2 告警规则配置
# prometheus-alerts.yaml
apiVersion: v1
kind: ConfigMap
metadata:
name: prometheus-alerts
namespace: monitor
data:
# 应用告警规则
contract-api-alerts.yml: |
groups:
- name: contract-api
interval: 30s
rules:
# 高错误率告警
- alert: ContractAPIHighErrorRate
expr: |
sum(rate(http_server_requests_seconds_count{
job="contract-api",
status=~"5.."
}[5m])) /
sum(rate(http_server_requests_seconds_count{
job="contract-api"
}[5m])) > 0.01
for: 5m
labels:
severity: critical
team: contract
annotations:
summary: "合同API错误率过高"
description: "合同API的5xx错误率超过1%,当前值: {{ $value | humanizePercentage }}"
runbook_url: "https://wiki.example.com/runbooks/high-error-rate"
# 高延迟告警
- alert: ContractAPIHighLatency
expr: |
histogram_quantile(0.95,
sum(rate(http_server_requests_seconds_bucket{
job="contract-api",
uri!="/actuator/health"
}[5m])) by (le, uri)
) > 2
for: 5m
labels:
severity: warning
team: contract
annotations:
summary: "合同API延迟过高"
description: "95分位延迟超过2秒,当前值: {{ $value | humanizeDuration }}"
# JVM堆内存告警
- alert: ContractAPIJVMHeapUsage
expr: |
jvm_memory_used_bytes{job="contract-api", area="heap"} /
jvm_memory_max_bytes{job="contract-api", area="heap"} > 0.85
for: 10m
labels:
severity: warning
team: contract
annotations:
summary: "JVM堆内存使用率过高"
description: "JVM堆内存使用率超过85%,当前值: {{ $value | humanizePercentage }}"
# 数据库连接池告警
- alert: ContractAPIDBPoolExhausted
expr: |
hikaricp_connections_active{pool="HikariPool-1"} /
hikaricp_connections_max{pool="HikariPool-1"} > 0.9
for: 5m
labels:
severity: critical
team: contract
annotations:
summary: "数据库连接池即将耗尽"
description: "活跃连接数超过最大连接的90%"
# AI模型调用失败告警
- alert: ContractAPIAIFailureRate
expr: |
sum(rate(ai_model_requests_total{
job="contract-api",
status="error"
}[5m])) /
sum(rate(ai_model_requests_total{
job="contract-api"
}[5m])) > 0.05
for: 5m
labels:
severity: critical
team: contract
annotations:
summary: "AI模型调用失败率过高"
description: "AI模型调用失败率超过5%,当前值: {{ $value | humanizePercentage }}"
# 服务不可用告警
- alert: ContractAPIServiceDown
expr: |
up{job="contract-api"} == 0
for: 1m
labels:
severity: critical
team: contract
annotations:
summary: "合同API服务不可用"
description: "合同API服务已经停止运行超过1分钟"
# Kubernetes集群告警规则
k8s-alerts.yml: |
groups:
- name: kubernetes
interval: 30s
rules:
# Pod CPU使用率过高
- alert: K8SPodCPUUsageHigh
expr: |
sum(rate(container_cpu_usage_seconds_total{
namespace="production",
pod=~"contract-api-.*"
}[5m])) by (pod) > 1.8
for: 10m
labels:
severity: warning
annotations:
summary: "Pod CPU使用率过高"
description: "Pod {{ $labels.pod }} CPU使用率超过90%,当前值: {{ $value | humanizePercentage }}"
# Pod内存使用率过高
- alert: K8SPodMemoryUsageHigh
expr: |
container_memory_working_set_bytes{
namespace="production",
pod=~"contract-api-.*"
} / container_spec_memory_limit_bytes{
namespace="production",
pod=~"contract-api-.*"
} > 0.85
for: 10m
labels:
severity: warning
annotations:
summary: "Pod内存使用率过高"
description: "Pod {{ $labels.pod }} 内存使用率超过85%"
# Pod重启次数过多
- alert: K8SPodRestartingTooMuch
expr: |
increase(kube_pod_container_status_restarts_total{
namespace="production",
pod=~"contract-api-.*"
}[1h]) > 3
for: 5m
labels:
severity: warning
annotations:
summary: "Pod重启次数过多"
description: "Pod {{ $labels.pod }} 在过去1小时内重启超过3次"
# HPA达到最大副本数
- alert: K8SHPAAtMaxReplicas
expr: |
kube_horizontalpodautoscaler_status_current_replicas{
namespace="production",
name="contract-api-hpa"
} >=
kube_horizontalpodautoscaler_spec_max_replicas{
namespace="production",
name="contract-api-hpa"
}
for: 5m
labels:
severity: warning
annotations:
summary: "HPA已达到最大副本数"
description: "合同API HPA已达到最大副本数 {{ $value }},建议检查负载情况"
20.4.3 Grafana Dashboard配置
# grafana-dashboard.yaml
apiVersion: v1
kind: ConfigMap
metadata:
name: grafana-dashboard-contract-api
namespace: monitor
data:
contract-api-dashboard.json: |
{
"dashboard": {
"title": "合同审核系统监控",
"uid": "contract-api",
"timezone": "Asia/Shanghai",
"panels": [
{
"title": "服务健康状态",
"type": "stat",
"gridPos": {"h": 4, "w": 6},
"targets": [
{
"expr": "up{job='contract-api'}",
"legendFormat": "{{pod}}"
}
],
"fieldConfig": {
"defaults": {
"mappings": [
{"type": "value", "options": {"0": {"text": "下线", "color": "red"}}},
{"type": "value", "options": {"1": {"text": "在线", "color": "green"}}}
]
}
}
},
{
"title": "QPS",
"type": "graph",
"gridPos": {"h": 8, "w": 12},
"targets": [
{
"expr": "sum(rate(http_server_requests_seconds_count{job='contract-api'}[1m]))",
"legendFormat": "总QPS"
},
{
"expr": "sum(rate(http_server_requests_seconds_count{job='contract-api', status=~'2..'}[1m]))",
"legendFormat": "成功QPS"
},
{
"expr": "sum(rate(http_server_requests_seconds_count{job='contract-api', status=~'5..'}[1m]))",
"legendFormat": "错误QPS"
}
]
},
{
"title": "响应时间P95/P99",
"type": "graph",
"gridPos": {"h": 8, "w": 12},
"targets": [
{
"expr": "histogram_quantile(0.95, sum(rate(http_server_requests_seconds_bucket{job='contract-api'}[5m])) by (le))",
"legendFormat": "P95"
},
{
"expr": "histogram_quantile(0.99, sum(rate(http_server_requests_seconds_bucket{job='contract-api'}[5m])) by (le))",
"legendFormat": "P99"
},
{
"expr": "histogram_quantile(0.50, sum(rate(http_server_requests_seconds_bucket{job='contract-api'}[5m])) by (le))",
"legendFormat": "P50"
}
]
},
{
"title": "JVM内存使用",
"type": "graph",
"gridPos": {"h": 8, "w": 12},
"targets": [
{
"expr": "jvm_memory_used_bytes{job='contract-api', area='heap'} / 1024 / 1024 / 1024",
"legendFormat": "堆内存使用 ({{pod}})"
},
{
"expr": "jvm_memory_max_bytes{job='contract-api', area='heap'} / 1024 / 1024 / 1024",
"legendFormat": "堆内存最大 ({{pod}})"
}
]
},
{
"title": "AI模型调用统计",
"type": "graph",
"gridPos": {"h": 8, "w": 12},
"targets": [
{
"expr": "sum(rate(ai_model_requests_total{job='contract-api'}[5m])) by (type)",
"legendFormat": "{{type}}"
}
]
},
{
"title": "数据库连接池",
"type": "graph",
"gridPos": {"h": 8, "w": 12},
"targets": [
{
"expr": "hikaricp_connections_active{pool='HikariPool-1'}",
"legendFormat": "活跃连接"
},
{
"expr": "hikaricp_connections_idle{pool='HikariPool-1'}",
"legendFormat": "空闲连接"
},
{
"expr": "hikaricp_connections_pending{pool='HikariPool-1'}",
"legendFormat": "等待连接"
}
]
}
]
}
}
──────────────────────────────────────────────────
ELK日志收集与分析
20.5.1 Filebeat配置
# filebeat-config.yaml
apiVersion: v1
kind: ConfigMap
metadata:
name: filebeat-config
namespace: monitor
data:
filebeat.yml: |
filebeat.inputs:
# 应用日志
- type: container
paths:
- /var/log/containers/contract-api-*.log
processors:
- add_kubernetes_metadata:
host: ${NODE_NAME}
matchers:
- logs_path:
logs_path: "/var/log/containers/"
- add_fields:
target: ''
fields:
service: contract-api
environment: production
json.keys_under_root: true
json.add_error_key: true
json.message_key: message
# 系统日志
- type: log
paths:
- /var/log/syslog
fields:
service: syslog
environment: production
processors:
- add_host_metadata:
cloud: auto
- add_cloud_metadata: ~
- add_docker_metadata: ~
- decode_json_fields:
fields: ["message"]
target: ""
overwrite_keys: true
add_error_key: true
- drop_event:
when:
regexp:
message: "^\\s+$"
output.logstash:
hosts: ["logstash.monitor.svc.cluster.local:5044"]
ssl.enabled: false
logging.level: info
logging.to_files: true
logging.files:
path: /var/log/filebeat
name: filebeat
keepfiles: 7
permissions: 0640
20.5.2 Logstash配置
# logstash-config.yaml
apiVersion: v1
kind: ConfigMap
metadata:
name: logstash-config
namespace: monitor
data:
logstash.yml: |
http.host: "0.0.0.0"
xpack.monitoring.elasticsearch.hosts: ["http://elasticsearch.monitor.svc.cluster.local:9200"]
pipeline.workers: 4
pipeline.batch.size: 125
# Logstash管道配置
contract-api.conf: |
input {
beats {
port => 5044
codec => json
}
}
filter {
# 应用日志处理
if [service] == "contract-api" {
# 解析时间戳
date {
match => ["timestamp", "ISO8601"]
target => "@timestamp"
}
# 提取日志级别
grok {
match => { "message" => "%{WORD:level}\s+%{DATA:class}\s+-\s+%{GREEDYDATA:log_message}" }
tag_on_failure => ["_grokparsefailure"]
}
# 异常堆栈处理
if [stack_trace] {
ruby {
code => "
stack_trace = event.get('stack_trace')
if stack_trace
# 限制堆栈长度
lines = stack_trace.split('\n')[0..10]
event.set('stack_trace', lines.join('\n'))
end
"
}
}
# 添加索引前缀
mutate {
add_field => { "index_prefix" => "contract-api" }
}
}
# 系统日志处理
if [service] == "syslog" {
grok {
match => { "message" => "%{SYSLOGTIMESTAMP:syslog_timestamp} %{SYSLOGHOST:syslog_hostname} %{DATA:syslog_program}(?:\[%{POSINT:syslog_pid}\])?: %{GREEDYDATA:syslog_message}" }
}
date {
match => ["syslog_timestamp", "MMM d HH:mm:ss", "MMM dd HH:mm:ss"]
target => "@timestamp"
}
mutate {
add_field => { "index_prefix" => "syslog" }
}
}
# 公共处理
mutate {
add_field => { "[@metadata][index_date]" => "%{+YYYY.MM.dd}" }
}
}
output {
elasticsearch {
hosts => ["http://elasticsearch.monitor.svc.cluster.local:9200"]
index => "%{index_prefix}-%{[@metadata][index_date]}"
document_type => "_doc"
}
}
20.5.3 Elasticsearch索引配置
# 创建索引模板
curl -X PUT "http://elasticsearch.monitor.svc.cluster.local:9200/_index_template/contract-api" \
-H "Content-Type: application/json" \
-d '{
"index_patterns": ["contract-api-*"],
"template": {
"settings": {
"number_of_shards": 3,
"number_of_replicas": 1,
"index.refresh_interval": "5s",
"index.lifecycle.name": "contract-api-policy",
"index.lifecycle.rollover_alias": "contract-api"
},
"mappings": {
"properties": {
"@timestamp": {
"type": "date"
},
"level": {
"type": "keyword"
},
"class": {
"type": "keyword"
},
"message": {
"type": "text",
"fields": {
"keyword": {
"type": "keyword",
"ignore_above": 256
}
}
},
"service": {
"type": "keyword"
},
"environment": {
"type": "keyword"
},
"trace_id": {
"type": "keyword"
},
"span_id": {
"type": "keyword"
},
"pod": {
"type": "keyword"
},
"namespace": {
"type": "keyword"
}
}
}
}
}'
# 查看索引列表
curl -X GET "http://elasticsearch.monitor.svc.cluster.local:9200/_cat/indices/contract-api-*?v"
# 查看索引健康状态
curl -X GET "http://elasticsearch.monitor.svc.cluster.local:9200/_cluster/health?index=contract-api-*"
──────────────────────────────────────────────────
持续集成与持续部署
20.6.1 GitHub Actions工作流
# .github/workflows/ci-cd.yml
name: Contract API CI/CD Pipeline
on:
push:
branches: [main, develop, 'release/*']
pull_request:
branches: [main]
workflow_dispatch:
env:
IMAGE_NAME: contract-api
REGISTRY: registry.example.com
HELM_chart: ./chart
jobs:
# ===================================================================
# 第一阶段:代码质量检查
# ===================================================================
code-quality:
name: Code Quality Check
runs-on: ubuntu-latest
steps:
- name: Checkout code
uses: actions/checkout@v4
with:
fetch-depth: 0
- name: Set up JDK 17
uses: actions/setup-java@v4
with:
java-version: '17'
distribution: 'temurin'
cache: 'maven'
- name: Cache Maven packages
uses: actions/cache@v3
with:
path: ~/.m2/repository
key: ${{ runner.os }}-m2-${{ hashFiles('**/pom.xml') }}
restore-keys: ${{ runner.os }}-m2
- name: Check code format
run: ./mvnw spotless:check
- name: SpotBugs Scan
run: ./mvnw spotbugs:check
- name: OWASP Dependency Check
run: ./mvnw org.owasp:dependency-check-maven-plugin:check
continue-on-error: true
- name: Upload Dependency Check Report
uses: actions/upload-artifact@v3
if: always()
with:
name: dependency-check-report
path: target/dependency-check-report.html
# ===================================================================
# 第二阶段:单元测试与集成测试
# ===================================================================
test:
name: Unit and Integration Tests
runs-on: ubuntu-latest
services:
mysql:
image: mysql:8.0
env:
MYSQL_ROOT_PASSWORD: test_password
MYSQL_DATABASE: contract_test
options: >-
--health-cmd="mysqladmin ping"
--health-interval=10s
--health-timeout=5s
--health-retries=5
ports:
- 3306:3306
redis:
image: redis:7-alpine
options: >-
--health-cmd="redis-cli ping"
--health-interval=10s
--health-timeout=5s
--health-retries=5
ports:
- 6379:6379
steps:
- name: Checkout code
uses: actions/checkout@v4
- name: Set up JDK 17
uses: actions/setup-java@v4
with:
java-version: '17'
distribution: 'temurin'
cache: 'maven'
- name: Run Unit Tests
run: ./mvnw test -Dspring.profiles.active=test
- name: Run Integration Tests
run: ./mvnw verify -Dspring.profiles.active=integration
- name: Upload Test Results
uses: actions/upload-artifact@v3
if: always()
with:
name: test-results
path: '**/target/surefire-reports/*.xml'
- name: Upload Coverage Reports
uses: codecov/codecov-action@v3
with:
files: '**/target/site/jacoco/jacoco.xml'
fail_ci_if_error: false
# ===================================================================
# 第三阶段:Docker镜像构建与推送
# ===================================================================
build-and-push:
name: Build and Push Docker Image
runs-on: ubuntu-latest
needs: [code-quality, test]
if: github.event_name == 'push' && github.ref == 'refs/heads/main'
outputs:
image-tag: ${{ steps.meta.outputs.tags }}
steps:
- name: Checkout code
uses: actions/checkout@v4
- name: Set up Docker Buildx
uses: docker/setup-buildx-action@v3
- name: Login to Container Registry
uses: docker/login-action@v3
with:
registry: ${{ env.REGISTRY }}
username: ${{ secrets.REGISTRY_USER }}
password: ${{ secrets.REGISTRY_TOKEN }}
- name: Extract metadata
id: meta
uses: docker/metadata-action@v5
with:
images: ${{ env.REGISTRY }}/${{ env.IMAGE_NAME }}
tags: |
type=ref,event=branch
type=sha,prefix={{branch}}-
type=raw,value=latest,enable={{is_default_branch}}
- name: Build and push with cache
uses: docker/build-push-action@v5
with:
context: .
push: true
tags: ${{ steps.meta.outputs.tags }}
cache-from: type=gha
cache-to: type=gha,mode=max
build-args: |
BUILD_VERSION=${{ github.sha }}
BUILD_DATE=${{ github.event.head_commit.timestamp }}
# ===================================================================
# 第四阶段:部署到测试环境
# ===================================================================
deploy-test:
name: Deploy to Test Environment
runs-on: ubuntu-latest
needs: build-and-push
environment: test
steps:
- name: Checkout code
uses: actions/checkout@v4
- name: Set up Helm
uses: azure/setup-helm@v3
with:
version: '3.13.0'
- name: Configure kubectl
uses: azure/k8s-set-context@v3
with:
kubeconfig: ${{ secrets.KUBE_CONFIG_TEST }}
- name: Deploy to Test
run: |
helm upgrade --install contract-api ${{ env.HELM_chart }} \
--namespace test \
--create-namespace \
--set image.repository=${{ env.REGISTRY }}/${{ env.IMAGE_NAME }} \
--set image.tag=${{ needs.build-and-push.outputs.image-tag }} \
--wait --timeout 10m \
--atomic \
--cleanup-on-fail
- name: Verify deployment
run: |
kubectl rollout status deployment/contract-api -n test --timeout=300s
kubectl get pods -n test -l app=contract-api
- name: Run Smoke Tests
run: |
sleep 30
ENDPOINT=$(kubectl get svc contract-api -n test -o jsonpath='{.spec.clusterIP}')
curl -f http://$ENDPOINT:8080/actuator/health || exit 1
# ===================================================================
# 第五阶段:部署到生产环境(需要手动审批)
# ===================================================================
deploy-production:
name: Deploy to Production Environment
runs-on: ubuntu-latest
needs: deploy-test
environment:
name: production
url: https://contract-api.example.com
if: github.ref == 'refs/heads/main'
steps:
- name: Checkout code
uses: actions/checkout@v4
- name: Set up Helm
uses: azure/setup-helm@v3
with:
version: '3.13.0'
- name: Configure kubectl
uses: azure/k8s-set-context@v3
with:
kubeconfig: ${{ secrets.KUBE_CONFIG_PROD }}
- name: Backup current deployment
run: |
kubectl get deployment contract-api -n production -o yaml > /tmp/backup-$(date +%Y%m%d%H%M%S).yaml
- name: Deploy to Production
run: |
helm upgrade --install contract-api ${{ env.HELM_chart }} \
--namespace production \
--create-namespace \
--set image.repository=${{ env.REGISTRY }}/${{ env.IMAGE_NAME }} \
--set image.tag=${{ needs.build-and-push.outputs.image-tag }} \
--wait --timeout 15m \
--atomic \
--cleanup-on-fail
- name: Verify deployment
run: |
kubectl rollout status deployment/contract-api -n production --timeout=600s
kubectl get pods -n production -l app=contract-api
- name: Run Production Smoke Tests
run: |
sleep 60
curl -f https://contract-api.example.com/actuator/health || exit 1
curl -f https://contract-api.example.com/api/v1/contract/health || exit 1
- name: Notify on Slack
if: always()
uses: slackapi/slack-github-action@v1
with:
channel-id: 'C0123456789'
payload: |
{
"text": "Contract API部署结果: ${{ job.status }}",
"attachments": [{
"color": "${{ job.status == 'success' && '#36a64f' || '#ff0000' }}",
"fields": [
{"title": "环境", "value": "Production", "short": true},
{"title": "版本", "value": "${{ needs.build-and-push.outputs.image-tag }}", "short": true},
{"title": "提交", "value": "${{ github.sha }}", "short": true}
]
}]
}
env:
SLACK_BOT_TOKEN: ${{ secrets.SLACK_BOT_TOKEN }}
20.6.2 部署脚本
#!/bin/bash
# ===================================================================
# 生产环境部署脚本
# 使用方式: ./deploy-production.sh [VERSION] [ENVIRONMENT]
# 示例: ./deploy-production.sh 1.0.0 production
# ===================================================================
set -e
VERSION=${1:-latest}
ENVIRONMENT=${2:-production}
NAMESPACE="production"
RELEASE_NAME="contract-api"
CHART_PATH="./chart"
# 颜色定义
RED='\033[0;31m'
GREEN='\033[0;32m'
YELLOW='\033[1;33m'
NC='\033[0m'
log_info() {
echo -e "${GREEN}[INFO]${NC} $1"
}
log_warn() {
echo -e "${YELLOW}[WARN]${NC} $1"
}
log_error() {
echo -e "${RED}[ERROR]${NC} $1"
}
# 检查前置条件
check_prerequisites() {
log_info "检查前置条件..."
command -v kubectl >/dev/null 2>&1 || { log_error "kubectl未安装"; exit 1; }
command -v helm >/dev/null 2>&1 || { log_error "helm未安装"; exit 1; }
kubectl cluster-info >/dev/null 2>&1 || { log_error "无法连接到Kubernetes集群"; exit 1; }
log_info "前置条件检查通过"
}
# 备份当前部署
backup_current_deployment() {
log_info "备份当前部署..."
BACKUP_FILE="/tmp/backup-${RELEASE_NAME}-$(date +%Y%m%d%H%M%S).yaml"
kubectl get deployment ${RELEASE_NAME} -n ${NAMESPACE} -o yaml > ${BACKUP_FILE}
log_info "备份已保存到: ${BACKUP_FILE}"
}
# 执行部署
deploy() {
log_info "开始部署 Contract API v${VERSION} 到 ${ENVIRONMENT}..."
helm upgrade --install ${RELEASE_NAME} ${CHART_PATH} \
--namespace ${NAMESPACE} \
--create-namespace \
--set image.tag=${VERSION} \
--wait --timeout 15m \
--atomic \
--cleanup-on-fail
log_info "部署命令执行完成"
}
# 验证部署
verify_deployment() {
log_info "验证部署状态..."
# 等待滚动更新完成
kubectl rollout status deployment/${RELEASE_NAME} -n ${NAMESPACE} --timeout=600s
# 检查Pod状态
READY_PODS=$(kubectl get pods -n ${NAMESPACE} -l app=${RELEASE_NAME} -o jsonpath='{.items[*].status.conditions[?(@.type=="Ready")].status}')
if [[ "$READY_PODS" != *"True"* ]]; then
log_error "Pod未就绪"
kubectl get pods -n ${NAMESPACE} -l app=${RELEASE_NAME}
exit 1
fi
# 健康检查
sleep 30
HEALTH_STATUS=$(curl -sf http://${RELEASE_NAME}.${NAMESPACE}.svc.cluster.local:8080/actuator/health || echo "failed")
if [[ "$HEALTH_STATUS" != *"UP"* ]]; then
log_error "健康检查失败"
exit 1
fi
log_info "部署验证通过"
}
# 发送通知
notify() {
log_info "发送部署通知..."
curl -X POST "${SLACK_WEBHOOK_URL}" \
-H 'Content-Type: application/json' \
-d "{
\"text\": \"Contract API部署完成\",
\"attachments\": [{
\"color\": \"#36a64f\",
\"fields\": [
{\"title\": \"环境\", \"value\": \"${ENVIRONMENT}\", \"short\": true},
{\"title\": \"版本\", \"value\": \"${VERSION}\", \"short\": true}
]
}]
}" 2>/dev/null || log_warn "通知发送失败"
}
# 回滚函数
rollback() {
log_warn "开始回滚..."
helm rollback ${RELEASE_NAME} -n ${NAMESPACE}
kubectl rollout undo deployment/${RELEASE_NAME} -n ${NAMESPACE}
log_info "回滚完成"
}
# 主函数
main() {
log_info "=========================================="
log_info " Contract API 部署脚本"
log_info "=========================================="
log_info "版本: ${VERSION}"
log_info "环境: ${ENVIRONMENT}"
log_info "=========================================="
check_prerequisites
backup_current_deployment
if deploy; then
if verify_deployment; then
notify
log_info "部署成功完成!"
else
log_error "验证失败,执行回滚..."
rollback
exit 1
fi
else
log_error "部署失败"
rollback
exit 1
fi
}
# 捕获Ctrl+C进行回滚
trap 'log_warn "捕获中断信号,开始回滚..."; rollback; exit 1' INT TERM
main "$@"
──────────────────────────────────────────────────
章节总结
20.7 核心知识点回顾
| 知识点 | 关键内容 |
|--------|----------|
| 验收测试清单 | 功能测试、性能测试、安全测试多维度覆盖 |
| 灰度发布 | Argo Rollout实现渐进式发布,自动分析与回滚 |
| 监控告警 | Prometheus指标采集+Grafana可视化+AlertManager告警 |
| 日志收集 | Filebeat采集+Logstash处理+Elasticsearch存储+Kibana分析 |
| CI/CD流水线 | GitHub Actions多阶段流水线,自动测试、构建、部署 |
20.8 最佳实践建议
- **测试驱动上线**:所有功能必须通过验收测试清单才能进入生产
2. **灰度发布优先**:始终使用灰度发布策略,第一时间发现并解决问题
3. **监控无死角**:覆盖基础设施、应用性能、业务指标三个层面
4. **日志即证据**:统一日志格式,便于问题追踪和审计
5. **自动化一切**:减少人工干预,提高交付效率和质量
20.9 扩展学习方向
- 学习ArgoCD实现GitOps方式的声明式部署
- 研究OpenTelemetry实现分布式追踪
- 探索Chaos Engineering(混沌工程)提高系统韧性
- 学习SRE最佳实践,建立SLO/SLA体系
──────────────────────────────────────────────────
*版权声明:本文为洛水石原创文章,版权所有,侵权必究。*
配图
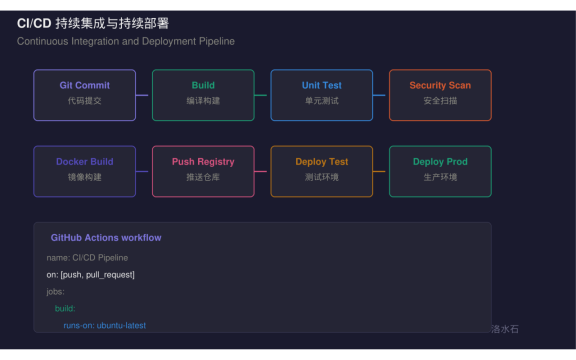 图: cicd pipeline diagram.png
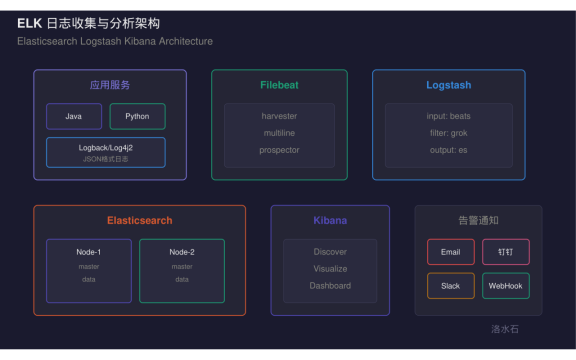 图: elk log architecture.png
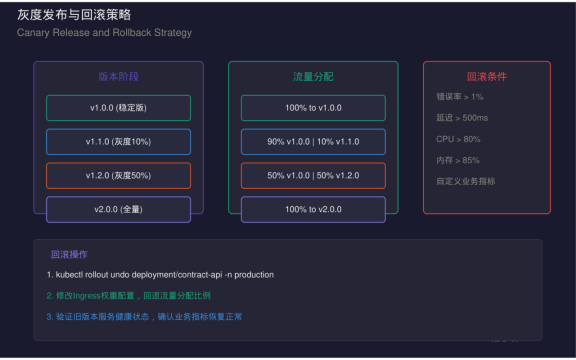 图: gray release rollback.png
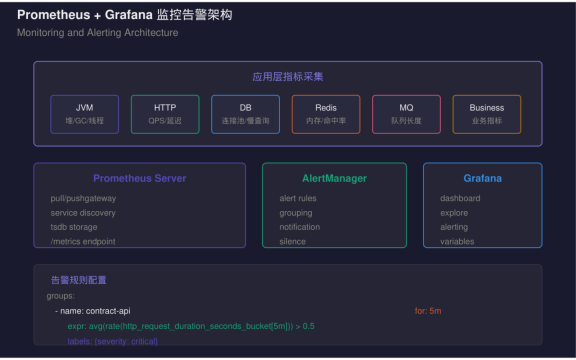 图: prometheus grafana monitoring.png

AtomGit 是由开放原子开源基金会联合 CSDN 等生态伙伴共同推出的新一代开源与人工智能协作平台。平台坚持“开放、中立、公益”的理念,把代码托管、模型共享、数据集托管、智能体开发体验和算力服务整合在一起,为开发者提供从开发、训练到部署的一站式体验。
更多推荐


 5
5 0
0- 0


 已为社区贡献69条内容

所有评论(0)