Java 程序员第 42 阶段18:文档智能解析审核,大模型实现合同摘要与合规校验,性能优化与压力测试
- 章节简介
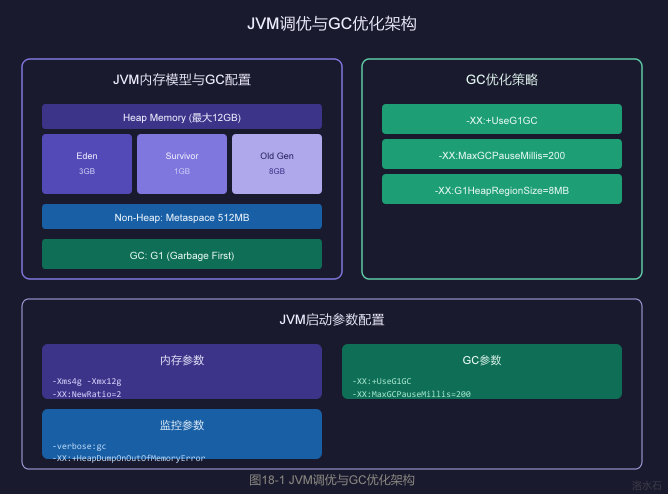
- JVM调优与GC优化
- 连接池配置(数据库、Redis、HTTP)
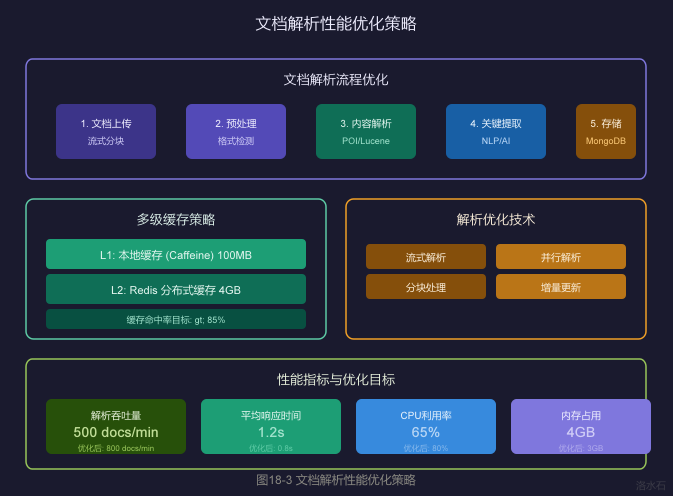
- 文档解析性能优化
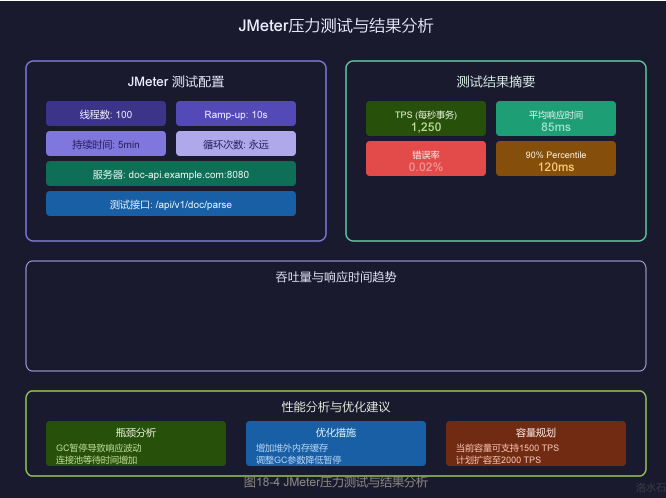
- JMeter压力测试
- 实际代码示例:性能监控配置
- 实际代码示例:缓存优化
- 实际代码示例:压力测试脚本与结果分析
- 章节总结
本章节将深入探讨文档智能解析审核系统的性能优化与压力测试。在实际生产环境中,系统的性能直接影响用户体验和业务吞吐量。本章节将详细介绍如何通过JVM调优、连接池优化、缓存策略等手段提升系统性能,以及如何使用JMeter进行压力测试验证优化效果。
1.1 章节内容概述
本章节涵盖以下核心技术点:
- **JVM调优**:深入讲解JVM内存模型、GC算法选择和参数配置
- **连接池优化**:详细介绍数据库、Redis、HTTP连接池的配置
- **缓存优化**:讲解多级缓存策略和本地缓存、分布式缓存的实现
- **性能监控**:介绍Micrometer、Prometheus等监控工具的使用
- **压力测试**:详细讲解JMeter的使用方法和结果分析
1.2 学习目标
通过本章节的学习,您将掌握:
- 理解JVM内存模型和GC工作原理
- 掌握主流连接池的配置和优化方法
- 学会设计多级缓存策略
- 掌握性能监控工具的使用
- 能够使用JMeter进行压力测试并分析结果
2.1 JVM内存模型详解
Java虚拟机运行时数据区包括以下几个部分:
2.1.1 堆内存(Heap)
堆是Java应用程序对象分配的主要区域,也是垃圾回收的主要管理区域。
堆内存结构:
┌────────────────────────────────────────────────────────────┐
│ Heap Memory │
├────────────────────────────────────────────────────────────┤
│ │
│ ┌──────────────────┐ ┌──────────────────┐ │
│ │ │ │ │ │
│ │ Young Generation │ │ Old Generation │ │
│ │ │ │ │ │
│ │ ┌─────┬─────┐ │ │ │ │
│ │ │Eden │ S0 │ S1 │ │ │ │
│ │ │ │ │ │ │ │ │
│ │ └─────┴─────┘ │ │ │ │
│ │ │ │ │ │
│ └──────────────────┘ └──────────────────┘ │
│ │
└────────────────────────────────────────────────────────────┘
|
区域 |
说明 |
大小建议 |
|
----- |
------ |
--------- |
|
Eden |
新对象分配区 |
占Young Gen的80% |
|
Survivor S0/S1 |
存活对象复制区 |
各占Young Gen的10% |
|
Old Generation |
长寿对象存储区 |
通常为Heap的60-70% |
2.1.2 非堆内存(Non-Heap)
┌─────────────────┬─────────────────┐
│ Metaspace │ Code Cache │
│ (元空间) │ (代码缓存) │
├─────────────────┴─────────────────┤
│ Direct ByteBuffer │
│ (直接内存/堆外内存) │
└───────────────────────────────────┘
|
区域 |
说明 |
大小建议 |
|
----- |
------ |
--------- |
|
Metaspace |
类元数据存储 |
512MB-1GB |
|
Code Cache |
JIT编译代码存储 |
240MB |
|
Direct Buffer |
堆外内存(NIO) |
视业务需求 |
2.2 GC算法对比与选择
2.2.1 常见GC算法
|
算法 |
原理 |
优点 |
缺点 |
适用场景 |
|
----- |
------ |
----- |
------ |
--------- |
|
Serial |
单线程串行GC |
简单高效 |
停顿时间长 |
单核、小堆 |
|
Parallel |
多线程并行GC |
吞吐率高 |
停顿时间长 |
多核、中大堆 |
|
CMS |
并发标记清除 |
停顿时间短 |
内存碎片、CPU消耗高 |
互联网应用 |
|
G1 |
区域化垃圾回收 |
可预测停顿、大堆友好 |
复杂度高 |
所有场景 |
|
ZGC |
着色指针并发GC |
停顿时间<1ms |
吞吐量略低 |
超大堆、低延迟 |
|
Shenandoah |
转发指针并发GC |
停顿时间短 |
需要改JVM |
低延迟场景 |
2.2.2 G1 GC配置推荐
# JVM启动参数 - G1 GC配置
JAVA_OPTS="
-server
# 堆内存配置
-Xms4g # 初始堆大小
-Xmx12g # 最大堆大小
-XX:NewRatio=2 # Old/New比例 2:1
-XX:SurvivorRatio=8 # Eden/Survivor比例 8:1
# G1 GC配置
-XX:+UseG1GC # 使用G1垃圾收集器
-XX:MaxGCPauseMillis=200 # 目标最大停顿时间200ms
-XX:G1HeapRegionSize=8m # Region大小8MB
-XX:InitiatingHeapOccupancyPercent=45 # 触发Mixed GC的堆使用率
-XX:G1ReservePercent=10 # 保留内存比例
# 并行GC线程
-XX:ParallelGCThreads=16 # 并行GC线程数
-XX:ConcGCThreads=4 # 并发GC线程数
# 参考配置公式: ParallelGCThreads = CPU核心数 * 5/8
"
2.3 生产环境JVM参数配置
#!/bin/bash
# Java应用启动脚本
JAVA_OPTS="-server"
# 内存配置
JAVA_OPTS="$JAVA_OPTS -Xms4g"
JAVA_OPTS="$JAVA_OPTS -Xmx12g"
JAVA_OPTS="$JAVA_OPTS -XX:NewRatio=2"
JAVA_OPTS="$JAVA_OPTS -XX:SurvivorRatio=8"
JAVA_OPTS="$JAVA_OPTS -XX:MaxTenuringThreshold=15"
JAVA_OPTS="$JAVA_OPTS -XX:MetaspaceSize=512m"
JAVA_OPTS="$JAVA_OPTS -XX:MaxMetaspaceSize=1g"
# G1 GC配置
JAVA_OPTS="$JAVA_OPTS -XX:+UseG1GC"
JAVA_OPTS="$JAVA_OPTS -XX:MaxGCPauseMillis=200"
JAVA_OPTS="$JAVA_OPTS -XX:G1HeapRegionSize=8m"
JAVA_OPTS="$JAVA_OPTS -XX:InitiatingHeapOccupancyPercent=45"
JAVA_OPTS="$JAVA_OPTS -XX:G1ReservePercent=10"
# GC日志配置
JAVA_OPTS="$JAVA_OPTS -Xlog:gc*:file=/data/logs/gc.log:time,uptime,level,tags"
JAVA_OPTS="$JAVA_OPTS -XX:+HeapDumpOnOutOfMemoryError"
JAVA_OPTS="$JAVA_OPTS -XX:HeapDumpPath=/data/logs/heapdump.hprof"
# 性能优化参数
JAVA_OPTS="$JAVA_OPTS -XX:+UseStringDeduplication"
JAVA_OPTS="$JAVA_OPTS -XX:+OptimizeStringConcat"
JAVA_OPTS="$JAVA_OPTS -XX:PrefetchLines=1"
JAVA_OPTS="$JAVA_OPTS -XX:+UseNUMA"
# 反射优化
JAVA_OPTS="$JAVA_OPTS -XX:+UseTypeSpeculation"
JAVA_OPTS="$JAVA_OPTS -XX:+Use BIC"
export JAVA_OPTS
java $JAVA_OPTS -jar document-processor.jar
2.4 GC性能监控与分析
2.4.1 常用GC监控命令
# 查看JVM进程
jps -lvm
# 查看GC统计信息
jstat -gcutil <pid> 1000 10
# 输出示例:
# S0C S1C S0U S1U EC EU OC OU MC MU CCSC CCU YGC YGCT FGC FGCT CGC CGCT GCT
# 0 0 0 0 1044480 716800.0 5242880 4194304.0 - - - - 12345 45.678 0 0.000 - - 45.678
# 导出GC日志分析
jstat -gcutil <pid> 1000 > gc_stats.log
# 生成堆转储
jmap -dump:format=b,file=heapdump.hprof <pid>
2.4.2 GC日志分析
// GC日志时间格式配置
-Xlog:gc*:file=gc.log:time,uptime,level,tags:filecount=10,filesize=100m
// 日志分析工具使用
// 使用 gceasy.io 在线分析GC日志
// 使用 GCViewer 本地分析
/*
示例GC日志解读:
[2024-01-01T12:00:00.123+0800] [info] [gc] GC(12345)
G1 Evacuation Pause (young) 2048M->2048M(12288M) 45.678ms
解析:
- G1 Evacuation Pause: G1垃圾收集暂停
- young: Young区收集
- 2048M->2048M: 收集前->收集后堆使用
- (12288M): 总堆大小
- 45.678ms: 暂停时间
*/
3.1 HikariCP数据库连接池
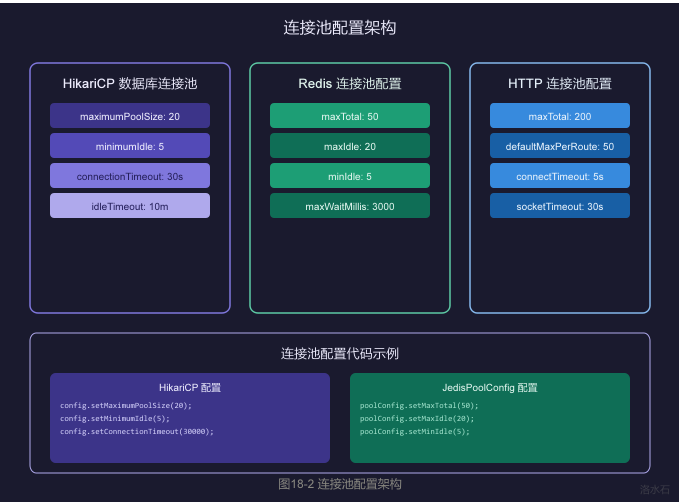
HikariCP是目前性能最优的数据库连接池,在配置合理的情况下,其吞吐量是其他连接池的2-3倍。
3.1.1 核心配置参数
# application.yml
spring:
datasource:
driver-class-name: com.mysql.cj.jdbc.Driver
url: jdbc:mysql://localhost:3306/document_db?useSSL=false&serverTimezone=Asia/Shanghai
username: doc_user
password: ${DB_PASSWORD}
# HikariCP配置
hikari:
# 连接池大小配置
maximum-pool-size: 20 # 最大连接数
minimum-idle: 5 # 最小空闲连接
connection-timeout: 30000 # 连接超时(ms)
idle-timeout: 600000 # 空闲超时(ms) 10分钟
max-lifetime: 1800000 # 最大生命周期(ms) 30分钟
# 连接池名称
pool-name: DocumentHikariPool
# 连接泄漏检测
leak-detection-threshold: 60000 # 60秒未归还视为泄漏
# 连接验证
connection-test-query: SELECT 1
# 性能优化
auto-commit: true
cachePrepStmts: true
prepStmtCacheSize: 250
prepStmtCacheSqlLimit: 2048
useServerPrepStmts: true
3.1.2 HikariCP高级配置
@Configuration
public class HikariCPConfig {
@Value("${spring.datasource.url}")
private String jdbcUrl;
@Value("${spring.datasource.username}")
private String username;
@Value("${spring.datasource.password}")
private String password;
@Bean
public DataSource dataSource() {
HikariConfig config = new HikariConfig();
// 基础配置
config.setJdbcUrl(jdbcUrl);
config.setUsername(username);
config.setPassword(password);
config.setDriverClassName("com.mysql.cj.jdbc.Driver");
// 连接池大小
config.setMaximumPoolSize(20);
config.setMinimumIdle(5);
// 超时配置
config.setConnectionTimeout(30000);
config.setIdleTimeout(600000);
config.setMaxLifetime(1800000);
// 连接泄漏检测
config.setLeakDetectionThreshold(60000);
// 连接验证
config.setConnectionTestQuery("SELECT 1");
config.setValidationTimeout(5000);
// MySQL特定优化
config.addDataSourceProperty("cachePrepStmts", "true");
config.addDataSourceProperty("prepStmtCacheSize", "250");
config.addDataSourceProperty("prepStmtCacheSqlLimit", "2048");
config.addDataSourceProperty("useServerPrepStmts", "true");
config.addDataSourceProperty("useLocalSessionState", "true");
config.addDataSourceProperty("rewriteBatchedStatements", "true");
config.addDataSourceProperty("cacheResultSetMetadata", "true");
config.addDataSourceProperty("cacheServerConfiguration", "true");
config.addDataSourceProperty("elideSetAutoCommits", "true");
config.addDataSourceProperty("maintainTimeStats", "false");
// 初始化
config.setPoolName("DocumentHikariPool");
config.setRegisterMbeans(true);
return new HikariDataSource(config);
}
}
3.2 Redis连接池配置
3.2.1 Jedis连接池配置
# application.yml
spring:
redis:
host: localhost
port: 6379
password: ${REDIS_PASSWORD}
database: 0
# Jedis连接池配置
jedis:
pool:
enabled: true
max-active: 50 # 最大连接数
max-idle: 20 # 最大空闲连接
min-idle: 5 # 最小空闲连接
max-wait: 3000 # 获取连接最大等待时间(ms)
# 连接检测
test-on-borrow: true # 借用时检测
test-on-return: false # 归还时检测
test-while-idle: true # 空闲时检测
test-on-create: false # 创建时检测
# 空闲检测配置
min-evictable-idle-time-millis: 60000 # 最小空闲时间
time-between-eviction-runs-millis: 30000 # 检测周期
# 连接耗尽策略
block-when-exhausted: true # 连接耗尽时阻塞
max-total: 50
3.2.2 Jedis连接池高级配置
@Configuration
public class JedisConfig {
@Value("${spring.redis.host}")
private String host;
@Value("${spring.redis.port}")
private int port;
@Value("${spring.redis.password}")
private String password;
@Value("${spring.redis.database}")
private int database;
@Bean
public JedisPoolConfig jedisPoolConfig() {
JedisPoolConfig config = new JedisPoolConfig();
// 连接池大小
config.setMaxTotal(50);
config.setMaxIdle(20);
config.setMinIdle(5);
// 连接获取策略
config.setMaxWaitMillis(3000);
config.setBlockWhenExhausted(true);
// 连接检测
config.setTestOnBorrow(true);
config.setTestOnReturn(false);
config.setTestWhileIdle(true);
// 空闲检测
config.setMinEvictableIdleTimeMillis(60000);
config.setTimeBetweenEvictionRunsMillis(30000);
config.setNumTestsPerEvictionRun(10);
// 连接创建
config.setTestOnCreate(false);
config.setJmxEnabled(true);
config.setJmxNamePrefix("jedis-pool");
return config;
}
@Bean
public JedisPool jedisPool(JedisPoolConfig poolConfig) {
JedisPoolConfig config = new JedisPoolConfig();
config.setMaxTotal(50);
config.setMaxIdle(20);
config.setMinIdle(5);
config.setMaxWaitMillis(3000);
return new JedisPool(
poolConfig,
host,
port,
2000, // 连接超时
password,
database,
null, // 客户端名称
false, // SSL
null, // SSL参数
null, // 超时
null // 重试策略
);
}
}
3.3 HTTP连接池配置
3.3.1 Apache HttpClient连接池
@Configuration
public class HttpClientConfig {
@Value("${http.max-total:200}")
private int maxTotal;
@Value("${http.default-max-per-route:50}")
private int defaultMaxPerRoute;
@Value("${http.connect-timeout:5000}")
private int connectTimeout;
@Value("${http.socket-timeout:30000}")
private int socketTimeout;
@Value("${http.connection-request-timeout:60000}")
private int connectionRequestTimeout;
@Bean
public PoolingHttpClientConnectionManager poolingConnectionManager() {
PoolingHttpClientConnectionManager connectionManager =
new PoolingHttpClientConnectionManager();
// 连接池大小
connectionManager.setMaxTotal(maxTotal);
connectionManager.setDefaultMaxPerRoute(defaultMaxPerRoute);
// 连接路由配置
connectionManager.setDefaultSocketConfig(
SocketConfig.custom()
.setSoTimeout(socketTimeout)
.setSoReuseAddress(true)
.setTcpNoDelay(true)
.build()
);
// 请求配置
connectionManager.setDefaultConnectionConfig(
ConnectionConfig.custom()
.setBufferSize(8192)
.setChunked(false)
.build()
);
return connectionManager;
}
@Bean
public CloseableHttpClient httpClient(PoolingHttpClientConnectionManager connectionManager) {
return HttpClientBuilder.create()
.setConnectionManager(connectionManager)
.setDefaultRequestConfig(requestConfig())
.setKeepAliveStrategy(defaultKeepAliveStrategy())
.evictIdleConnections(30, TimeUnit.SECONDS)
.evictExpiredConnections()
.build();
}
@Bean
public RequestConfig requestConfig() {
return RequestConfig.custom()
.setConnectTimeout(connectTimeout)
.setSocketTimeout(socketTimeout)
.setConnectionRequestTimeout(connectionRequestTimeout)
.setRedirectsEnabled(true)
.setMaxRedirects(3)
.setRelativeRedirectsAllowed(true)
.build();
}
@Bean
public ConnectionKeepAliveStrategy defaultKeepAliveStrategy() {
return (response, context) -> {
HeaderElementIterator it = new BasicHeaderElementIterator(
response.headerIterator(HTTP.CONN_KEEP_ALIVE));
while (it.hasNext()) {
HeaderElement header = it.nextElement();
String param = header.getName();
String value = header.getValue();
if (value != null && param.equalsIgnoreCase("timeout")) {
try {
return Long.parseLong(value) * 1000;
} catch (NumberFormatException ignored) {
}
}
}
return 5 * 60 * 1000; // 默认5分钟
};
}
}
4.1 多级缓存策略
4.1.1 缓存架构设计
┌─────────────────────────────────────────────────────────────┐
│ 请求入口 │
└────────────────────────────┬────────────────────────────────┘
│
▼
┌─────────────────────────────────────────────────────────────┐
│ L1: 本地缓存 (Caffeine) │
│ 大小: 100MB │
│ 命中率目标: 60% │
│ 过期: 5分钟 │
└────────────────────────────┬────────────────────────────────┘
│ Miss
▼
┌─────────────────────────────────────────────────────────────┐
│ L2: Redis 分布式缓存 │
│ 大小: 4GB │
│ 命中率目标: 25% │
│ 过期: 30分钟 │
└────────────────────────────┬────────────────────────────────┘
│ Miss
▼
┌─────────────────────────────────────────────────────────────┐
│ 数据库/存储 │
│ (MySQL / MongoDB) │
└─────────────────────────────────────────────────────────────┘
4.1.2 Caffeine本地缓存配置
@Configuration
public class CaffeineCacheConfig {
@Bean
public Cache<String, DocumentParseResult> documentParseCache() {
return Caffeine.newBuilder()
// 容量配置
.maximumSize(10_000) // 最大缓存数量
.maximumWeight(100 * 1024 * 1024) // 最大内存权重 100MB
.weigher((key, value) -> estimateSize(value))
// 过期策略
.expireAfterWrite(Duration.ofMinutes(5)) // 写入后5分钟过期
.expireAfterAccess(Duration.ofMinutes(2)) // 访问后2分钟过期
// 刷新策略
.refreshAfterWrite(Duration.ofMinutes(3)) // 3分钟后刷新
// 统计
.recordStats()
// 淘汰监听
.removalListener((key, value, cause) ->
log.info("缓存淘汰, key: {}, 原因: {}", key, cause))
.build();
}
@Bean
public LoadingCache<String, DocumentMetadata> documentMetadataCache() {
return Caffeine.newBuilder()
.maximumSize(50_000)
.expireAfterWrite(Duration.ofMinutes(10))
.refreshAfterWrite(Duration.ofMinutes(5))
.recordStats()
.build(key -> loadFromDatabase(key));
}
private int estimateSize(DocumentParseResult result) {
// 估算缓存对象大小
return 1024; // 默认1KB
}
private DocumentMetadata loadFromDatabase(String key) {
// 从数据库加载
return documentMetadataMapper.selectById(key);
}
}
4.1.3 多级缓存实现
@Service
@RequiredArgsConstructor
@Slf4j
public class MultiLevelCacheService {
private final Cache<String, DocumentParseResult> localCache;
private final StringRedisTemplate redisTemplate;
private final DocumentMapper documentMapper;
private static final String CACHE_KEY_PREFIX = "doc:parse:";
private static final long REDIS_CACHE_TTL = 30 * 60; // 30分钟
/**
* 三级缓存查询
*/
public DocumentParseResult getParseResult(String documentId) {
String cacheKey = CACHE_KEY_PREFIX + documentId;
// L1: 查询本地缓存
DocumentParseResult result = localCache.getIfPresent(cacheKey);
if (result != null) {
log.debug("L1缓存命中, documentId: {}", documentId);
return result;
}
// L2: 查询Redis缓存
result = getFromRedis(cacheKey);
if (result != null) {
log.debug("L2缓存命中, documentId: {}", documentId);
// 回填本地缓存
localCache.put(cacheKey, result);
return result;
}
// L3: 查询数据库
result = loadFromDatabase(documentId);
if (result != null) {
log.debug("L3缓存命中, documentId: {}", documentId);
// 回填L2和L1缓存
putToRedis(cacheKey, result);
localCache.put(cacheKey, result);
}
return result;
}
/**
* 更新缓存
*/
public void updateCache(String documentId, DocumentParseResult result) {
String cacheKey = CACHE_KEY_PREFIX + documentId;
// 更新所有级别缓存
localCache.put(cacheKey, result);
putToRedis(cacheKey, result);
}
/**
* 删除缓存
*/
public void evictCache(String documentId) {
String cacheKey = CACHE_KEY_PREFIX + documentId;
localCache.invalidate(cacheKey);
redisTemplate.delete(cacheKey);
}
/**
* 获取缓存命中率统计
*/
public CacheStats getCacheStats() {
CacheStats localStats = localCache.stats();
// Redis缓存统计通过Micrometer采集
return localStats;
}
}
4.2 文档解析优化技术
4.2.1 流式解析
@Service
@RequiredArgsConstructor
public class StreamDocumentParser {
private final DocumentParserFactory parserFactory;
/**
* 流式解析大文件
*/
public ParseResult parseDocumentStream(InputStream inputStream,
String documentId,
DocumentType type) {
DocumentParser parser = parserFactory.getParser(type);
// 使用流式解析
try (BufferedReader reader = new BufferedReader(
new InputStreamReader(inputStream, StandardCharsets.UTF_8))) {
StringBuilder content = new StringBuilder();
String line;
int lineCount = 0;
while ((line = reader.readLine()) != null) {
content.append(line);
lineCount++;
// 每1000行处理一次
if (lineCount % 1000 == 0) {
parser.processPartialContent(content.toString());
content.setLength(0);
content.append(line); // 保留当前行
}
}
// 处理剩余内容
if (content.length() > 0) {
parser.processPartialContent(content.toString());
}
return parser.finalizeParse();
} catch (Exception e) {
log.error("流式解析失败, documentId: {}", documentId, e);
throw new ParseException("文档解析失败", e);
}
}
/**
* 分块并行解析
*/
public ParseResult parseDocumentParallel(InputStream inputStream,
String documentId,
int chunkSize) throws Exception {
byte[] buffer = new byte[chunkSize];
int bytesRead;
List<CompletableFuture<ChunkResult>> futures = new ArrayList<>();
while ((bytesRead = inputStream.read(buffer)) != -1) {
final byte[] chunk = Arrays.copyOf(buffer, bytesRead);
final int chunkIndex = futures.size();
CompletableFuture<ChunkResult> future =
CompletableFuture.supplyAsync(() -> parseChunk(chunk, chunkIndex));
futures.add(future);
}
// 等待所有分块完成
CompletableFuture.allOf(futures.toArray(new CompletableFuture[0])).join();
// 合并结果
return mergeResults(futures);
}
private ChunkResult parseChunk(byte[] chunk, int chunkIndex) {
// 解析单个分块
return new ChunkResult(chunkIndex, parseBytes(chunk));
}
}
4.2.2 解析结果压缩存储
@Service
@RequiredArgsConstructor
public class CompressedStorageService {
private final MongoTemplate mongoTemplate;
/**
* 压缩存储解析结果
*/
public void saveCompressedResult(String documentId,
DocumentParseResult result) throws IOException {
// 序列化为JSON
ObjectMapper mapper = new ObjectMapper();
String json = mapper.writeValueAsString(result);
// Gzip压缩
ByteArrayOutputStream baos = new ByteArrayOutputStream();
try (GZIPOutputStream gzos = new GZIPOutputStream(baos)) {
gzos.write(json.getBytes(StandardCharsets.UTF_8));
}
byte[] compressed = baos.toByteArray();
// 存储到MongoDB
Document doc = new Document();
doc.put("_id", documentId);
doc.put("compressed", true);
doc.put("data", compressed);
doc.put("originalSize", json.length());
doc.put("compressedSize", compressed.length);
doc.put("timestamp", System.currentTimeMillis());
mongoTemplate.save(doc, "document_results");
log.info("压缩存储完成, documentId: {}, 原始: {} bytes, 压缩后: {} bytes",
documentId, json.length(), compressed.length);
}
/**
* 解压读取解析结果
*/
public DocumentParseResult loadDecompressedResult(String documentId)
throws IOException {
Document doc = mongoTemplate.findById(documentId, Document.class, "document_results");
if (doc == null) {
return null;
}
byte[] compressed = (byte[]) doc.get("data");
// 解压
ByteArrayInputStream bais = new ByteArrayInputStream(compressed);
ByteArrayOutputStream baos = new ByteArrayOutputStream();
try (GZIPInputStream gzis = new GZIPInputStream(bais)) {
byte[] buffer = new byte[1024];
int len;
while ((len = gzis.read(buffer)) != -1) {
baos.write(buffer, 0, len);
}
}
String json = baos.toString(StandardCharsets.UTF_8);
ObjectMapper mapper = new ObjectMapper();
return mapper.readValue(json, DocumentParseResult.class);
}
}
5.1 JMeter安装与配置
5.1.1 JMeter安装步骤
# 1. 下载JMeter
wget https://archive.apache.org/dist/jmeter/binaries/apache-jmeter-5.6.3.tgz
# 2. 解压
tar -xzf apache-jmeter-5.6.3.tgz
# 3. 设置环境变量
export JMETER_HOME=/opt/apache-jmeter-5.6.3
export PATH=$PATH:$JMETER_HOME/bin
# 4. 启动JMeter
jmeter -v
5.1.2 JMeter目录结构
apache-jmeter-5.6.3/
├── bin/ # 启动脚本和配置文件
│ ├── jmeter # Linux启动脚本
│ ├── jmeter.bat # Windows启动脚本
│ └── jmeter.properties # 配置文件
├── lib/ # 依赖库
├── ext/ # JMeter插件
└── docs/ # 文档
5.2 测试计划配置
5.2.1 HTTP请求配置
<!-- TestPlan XML示例 -->
<TestPlan name="Document Processing Test" enabled="true"
functionalMode="false" preserveSemantics="false"
version="1.0" onError="continue">
<property name="TestPlan.comments"></property>
<boolProp name="TestPlan.functional_mode">false</boolProp>
<boolProp name="TestPlan.serialize_threadgroups">false</boolProp>
<hashTree>
<!-- Thread Group配置 -->
<ThreadGroup guiclass="ThreadGroupGui"
testclass="ThreadGroup"
testname="Document Parse Thread"
enabled="true">
<stringProp name="ThreadGroup.num_threads">100</stringProp>
<stringProp name="ThreadGroup.ramp_time">10</stringProp>
<stringProp name="ThreadGroup.duration">300</stringProp>
<stringProp name="ThreadGroup.delay">0</stringProp>
<boolProp name="ThreadGroup.scheduler">true</boolProp>
</ThreadGroup>
<hashTree>
<!-- HTTP Request配置 -->
<HTTPSamplerProxy guiclass="HttpTestSampleGui"
testclass="HTTPSamplerProxy"
testname="POST /api/v1/doc/parse">
<elementProp name="HTTPsampler.Arguments"
elementType="Arguments"
guiclass="HTTPArgumentsPanel">
<collectionProp name="Arguments.arguments">
<elementProp name="documentId" elementType="HTTPArgument">
<stringProp name="Argument.value">doc_${__threadNum}</stringProp>
</elementProp>
<elementProp name="documentType" elementType="HTTPArgument">
<stringProp name="Argument.value">CONTRACT</stringProp>
</elementProp>
</collectionProp>
</elementProp>
<stringProp name="HTTPSampler.domain">doc-api.example.com</stringProp>
<stringProp name="HTTPSampler.port">8080</stringProp>
<stringProp name="HTTPSampler.protocol">http</stringProp>
<stringProp name="HTTPSampler.method">POST</stringProp>
<stringProp name="HTTPSampler.path">/api/v1/doc/parse</stringProp>
</HTTPSamplerProxy>
</hashTree>
</hashTree>
</TestPlan>
5.3 JMeter脚本配置
5.3.1 创建测试脚本
#!/bin/bash
# run_test.sh - JMeter压力测试执行脚本
JMETER_HOME="/opt/apache-jmeter-5.6.3"
TEST_DIR="/opt/jmeter-tests"
RESULTS_DIR="/opt/jmeter-results/$(date +%Y%m%d_%H%M%S)"
mkdir -p $RESULTS_DIR
# 测试配置
THREADS=100 # 线程数
RAMP_UP=10 # 启动时间(秒)
DURATION=300 # 持续时间(秒)
TARGET_HOST="doc-api.example.com"
TARGET_PORT=8080
echo "=========================================="
echo "JMeter 压力测试"
echo "=========================================="
echo "目标主机: $TARGET_HOST:$TARGET_PORT"
echo "线程数: $THREADS"
echo "启动时间: $RAMP_UP 秒"
echo "持续时间: $DURATION 秒"
echo "结果目录: $RESULTS_DIR"
echo "=========================================="
# 执行测试
$JMETER_HOME/bin/jmeter \
-n \
-t $TEST_DIR/document_parse_test.jmx \
-l $RESULTS_DIR/results.jtl \
-j $RESULTS_DIR/jmeter.log \
-e \
-o $RESULTS_DIR/html-report \
-Jthreads=$THREADS \
-Jrampup=$RAMP_UP \
-Jduration=$DURATION \
-Jhost=$TARGET_HOST \
-Jport=$TARGET_PORT
# 生成测试报告
echo ""
echo "=========================================="
echo "测试完成!"
echo "=========================================="
echo "结果文件: $RESULTS_DIR/results.jtl"
echo "HTML报告: $RESULTS_DIR/html-report/index.html"
echo "日志文件: $RESULTS_DIR/jmeter.log"
5.3.2 JMeter属性配置
# jmeter.properties 自定义配置
# 服务器配置
host=doc-api.example.com
port=8080
# 线程配置
threads=100
rampup=10
duration=300
# 结果配置
jmeter.save.saveservice.output_format=csv
jmeter.save.saveservice.response_data=false
jmeter.save.saveservice.samplerData=false
jmeter.save.saveservice.requestHeaders=false
jmeter.save.saveservice.url=true
jmeter.save.saveservice.responseHeaders=false
jmeter.save.saveservice.successful=true
jmeter.save.saveservice.label=true
jmeter.save.saveservice.latency=true
jmeter.save.saveservice.response_time=true
jmeter.save.saveservice.thread_name=true
jmeter.save.saveservice.time=true
# CSV输出格式
sample_variables=responseTime,latency,bytes,sentBytes,grpThreads,allThreads
# 报告配置
jmeter.reportgenerator.overall_granularity=1000
5.4 测试结果分析
5.4.1 关键性能指标
|
指标 |
说明 |
合格标准 |
|
----- |
------ |
--------- |
|
TPS |
每秒事务数 |
> 1000 |
|
平均响应时间 |
请求平均耗时 |
< 100ms |
|
90%响应时间 |
90%请求在此时间内完成 |
< 150ms |
|
99%响应时间 |
99%请求在此时间内完成 |
< 200ms |
|
错误率 |
失败请求比例 |
< 0.1% |
|
吞吐量 |
服务器处理能力 |
根据业务需求 |
5.4.2 结果分析示例
# 使用JMeter分析工具解析结果
$JMETER_HOME/bin/jmeter.sh \
-g results.jtl \
-o analysis-report
# 使用命令行分析CSV结果
awk -F',' '
NR>1 {
sum += $1;
count++;
if($1 > max) max = $1;
if($1 < min || min==0) min = $1;
# 计算百分位数
p90_arr[int(count*0.9)] = $1;
p99_arr[int(count*0.99)] = $1;
}
END {
avg = sum/count;
p90 = p90_arr[int(count*0.9)];
p99 = p99_arr[int(count*0.99)];
printf "========== 性能测试结果分析 ==========\n";
printf "总请求数: %d\n", count;
printf "平均响应时间: %.2f ms\n", avg;
printf "最大响应时间: %.2f ms\n", max;
printf "最小响应时间: %.2f ms\n", min;
printf "90%%百分位: %.2f ms\n", p90;
printf "99%%百分位: %.2f ms\n", p99;
printf "=====================================\n";
}' results.jtl
6.1 Micrometer监控配置
@Configuration
@EnableScheduling
public class MetricsConfig {
@Bean
public MeterRegistry meterRegistry() {
// 配置Prometheus推送网关
PrometheusConfig prometheusConfig = new PrometheusConfig() {
@Override
public String get(String key) {
if ("prometheus.pushgateway.enabled".equals(key)) {
return "true";
}
return null;
}
};
return new PrometheusMeterRegistry(prometheusConfig,
Clock.SYSTEM,
AggregatorConfig.DEFAULT,
CollectorRegistry.defaultRegistry);
}
@Bean
public DataSourceMetricsBinder dataSourceMetricsBinder(DataSource dataSource) {
return new DataSourceMetricsBinder(dataSource, meterRegistry());
}
}
6.2 自定义指标
@Service
@Slf4j
public class DocumentProcessingMetrics {
private final MeterRegistry meterRegistry;
private final Timer parseTimer;
private final Counter parseSuccessCounter;
private final Counter parseFailedCounter;
private final DistributionSummary documentSizeSummary;
public DocumentProcessingMetrics(MeterRegistry meterRegistry) {
this.meterRegistry = meterRegistry;
// 解析耗时计时器
this.parseTimer = Timer.builder("document.parse.time")
.description("文档解析耗时")
.tag("type", "processing")
.publishPercentiles(0.5, 0.9, 0.95, 0.99)
.publishPercentileHistogram()
.register(meterRegistry);
// 成功计数
this.parseSuccessCounter = Counter.builder("document.parse.success")
.description("文档解析成功次数")
.tag("type", "success")
.register(meterRegistry);
// 失败计数
this.parseFailedCounter = Counter.builder("document.parse.failed")
.description("文档解析失败次数")
.tag("type", "failed")
.register(meterRegistry);
// 文档大小分布
this.documentSizeSummary = DistributionSummary.builder("document.size")
.description("文档大小分布")
.baseUnit("bytes")
.publishPercentiles(0.5, 0.9, 0.99)
.register(meterRegistry);
}
/**
* 记录解析耗时
*/
public <T> T recordParseTime(Supplier<T> operation) {
return parseTimer.record(operation);
}
/**
* 记录成功
*/
public void recordSuccess(String documentType) {
parseSuccessCounter.increment();
}
/**
* 记录失败
*/
public void recordFailed(String documentType, String errorType) {
parseFailedCounter.increment();
}
/**
* 记录文档大小
*/
public void recordDocumentSize(long size) {
documentSizeSummary.record(size);
}
/**
* 获取当前指标快照
*/
public MetricsSnapshot getSnapshot() {
return MetricsSnapshot.builder()
.tps(calculateTPS())
.avgResponseTime(parseTimer.mean(TimeUnit.MILLISECONDS))
.p99ResponseTime(parseTimer.percentile(0.99, TimeUnit.MILLISECONDS))
.errorRate(calculateErrorRate())
.activeThreads(getActiveThreads())
.build();
}
}
6.3 GC监控
@Component
@Slf4j
public class GcMetricsCollector {
private final MeterRegistry meterRegistry;
private final MemoryPoolMXBean edenSpace;
private final MemoryPoolMXBean oldGen;
public GcMetricsCollector(MeterRegistry meterRegistry) {
this.meterRegistry = meterRegistry;
// 获取内存池
List<MemoryPoolMXBean> pools = ManagementFactory.getMemoryPoolMXBeans();
this.edenSpace = pools.stream()
.filter(p -> p.getName().contains("Eden Space"))
.findFirst()
.orElse(null);
this.oldGen = pools.stream()
.filter(p -> p.getName().contains("Old Gen"))
.findFirst()
.orElse(null);
// 注册内存指标
if (edenSpace != null) {
Gauge.builder("gc.eden.usage", edenSpace,
p -> p.getUsage().getUsed() / 1024.0 / 1024.0)
.description("Eden区使用大小(MB)")
.register(meterRegistry);
}
if (oldGen != null) {
Gauge.builder("gc.old.usage", oldGen,
p -> p.getUsage().getUsed() / 1024.0 / 1024.0)
.description("Old区使用大小(MB)")
.register(meterRegistry);
}
}
/**
* 获取GC统计信息
*/
public GcStats getGcStats() {
List<GarbageCollectorMXBean> gcBeans =
ManagementFactory.getGarbageCollectorMXBeans();
long totalGcCount = 0;
long totalGcTime = 0;
for (GarbageCollectorMXBean gcBean : gcBeans) {
totalGcCount += gcBean.getCollectionCount();
totalGcTime += gcBean.getCollectionTime();
}
return GcStats.builder()
.gcCount(totalGcCount)
.gcTime(totalGcTime)
.edenUsage(edenSpace != null ? edenSpace.getUsage().getUsed() : 0)
.oldGenUsage(oldGen != null ? oldGen.getUsage().getUsed() : 0)
.build();
}
}
7.1 Redis缓存优化
@Service
@RequiredArgsConstructor
public class RedisCacheOptimizer {
private final StringRedisTemplate redisTemplate;
/**
* 批量获取缓存
*/
public List<String> batchGet(List<String> keys) {
if (keys == null || keys.isEmpty()) {
return Collections.emptyList();
}
String[] keyArray = keys.toArray(new String[0]);
List<String> values = redisTemplate.opsForValue().multiGet(keys);
return values != null ? values : Collections.emptyList();
}
/**
* 批量设置缓存(使用Pipeline)
*/
public void batchSet(Map<String, String> keyValues, long ttlSeconds) {
if (keyValues == null || keyValues.isEmpty()) {
return;
}
redisTemplate.executePipelined((RedisCallback<Object>) connection -> {
for (Map.Entry<String, String> entry : keyValues.entrySet()) {
Byte[] keyBytes = Serializer.stringToBytes(entry.getKey());
Byte[] valueBytes = Serializer.stringToBytes(entry.getValue());
connection.stringCommands().setEx(keyBytes, ttlSeconds, valueBytes);
}
return null;
});
}
/**
* 缓存预热
*/
@Scheduled(cron = "0 0 3 * * ?") // 每天凌晨3点
public void warmUpCache() {
log.info("开始缓存预热...");
// 预热热门文档
List<String> hotDocumentIds = findHotDocuments();
for (String docId : hotDocumentIds) {
try {
DocumentParseResult result = loadAndCacheDocument(docId);
log.debug("缓存预热完成, documentId: {}", docId);
} catch (Exception e) {
log.error("缓存预热失败, documentId: {}", docId, e);
}
}
log.info("缓存预热完成, 共预热 {} 个文档", hotDocumentIds.size());
}
/**
* 查找热门文档
*/
private List<String> findHotDocuments() {
// 查询最近访问量最高的文档
return documentMapper.selectHotDocuments(1000);
}
}
7.2 本地缓存优化
@Component
@Slf4j
public class LocalCacheOptimizer {
private final Cache<String, Object> cache;
private final MeterRegistry meterRegistry;
public LocalCacheOptimizer(MeterRegistry meterRegistry) {
this.cache = Caffeine.newBuilder()
.maximumSize(10_000)
.expireAfterWrite(Duration.ofMinutes(5))
.recordStats()
.removalListener((key, value, cause) -> {
log.debug("缓存淘汰, key: {}, 原因: {}", key, cause);
})
.build();
// 注册缓存命中率指标
CacheMetrics.monitor(meterRegistry, "document.cache", cache);
}
/**
* 异步刷新缓存
*/
public void refreshAsync(String key, Callable<Object> loader) {
CompletableFuture.runAsync(() -> {
try {
Object value = loader.call();
cache.put(key, value);
} catch (Exception e) {
log.error("缓存刷新失败, key: {}", key, e);
}
});
}
/**
* 获取缓存统计
*/
public CacheStats getStats() {
return cache.stats();
}
}
8.1 JMeter测试计划XML
<?xml version="1.0" encoding="UTF-8"?>
<jmeterTestPlan version="1.2" properties="5.0" jmeter="5.6.3">
<hashTree>
<TestPlan gui="TestPlanGui" enabled="true"
functionalMode="false"
onError="continue"
version="1.0">
<stringProp name="TestPlan.comments">文档处理系统压力测试计划</stringProp>
<boolProp name="TestPlan.serialize_threadgroups">false</boolProp>
<elementProp name="TestPlan.user_defined_variables"
elementType="Arguments">
<collectionProp name="Arguments.arguments"/>
</elementProp>
</TestPlan>
<hashTree>
<!-- 线程组配置 -->
<ThreadGroup guiclass="ThreadGroupGui"
testclass="ThreadGroup"
testname="Document Parse Threads"
enabled="true">
<stringProp name="ThreadGroup.num_threads">100</stringProp>
<stringProp name="ThreadGroup.ramp_time">10</stringProp>
<boolProp name="ThreadGroup.scheduler">true</boolProp>
<stringProp name="ThreadGroup.duration">300</stringProp>
<stringProp name="ThreadGroup.delay">0</stringProp>
</ThreadGroup>
<hashTree>
<!-- HTTP Header配置 -->
<HeaderManager guiclass="HeaderPanel"
testclass="HeaderManager"
testname="HTTP Header Manager">
<collectionProp name="HeaderManager.headers">
<elementProp name="" elementType="Header">
<stringProp name="Header.name">Content-Type</stringProp>
<stringProp name="Header.value">application/json</stringProp>
</elementProp>
<elementProp name="" elementType="Header">
<stringProp name="Header.name">Authorization</stringProp>
<stringProp name="Header.value">Bearer ${TOKEN}</stringProp>
</elementProp>
</collectionProp>
</HeaderManager>
<hashTree>
<!-- POST请求 -->
<HTTPSamplerProxy guiclass="HttpTestSampleGui"
testclass="HTTPSamplerProxy"
testname="POST /api/v1/doc/parse"
enabled="true">
<stringProp name="HTTPSampler.domain">${HOST}</stringProp>
<stringProp name="HTTPSampler.port">${PORT}</stringProp>
<stringProp name="HTTPSampler.protocol">http</stringProp>
<stringProp name="HTTPSampler.method">POST</stringProp>
<stringProp name="HTTPSampler.path">/api/v1/doc/parse</stringProp>
<boolProp name="HTTPSampler.follow_redirects">true</boolProp>
<boolProp name="HTTPSampler.auto_redirects">false</boolProp>
<elementProp name="HTTPsampler.Arguments"
elementType="Arguments"
guiclass="HTTPArgumentsPanel">
<collectionProp name="Arguments.arguments">
<elementProp name="documentId" elementType="HTTPArgument">
<stringProp name="Argument.name">documentId</stringProp>
<stringProp name="Argument.value">doc-${__threadNum}-${__time()}</stringProp>
<boolProp name="HTTPArgument.use_equals">true</boolProp>
</elementProp>
<elementProp name="documentType" elementType="HTTPArgument">
<stringProp name="Argument.name">documentType</stringProp>
<stringProp name="Argument.value">CONTRACT</stringProp>
<boolProp name="HTTPArgument.use_equals">true</boolProp>
</elementProp>
</collectionProp>
</elementProp>
</HTTPSamplerProxy>
</hashTree>
</hashTree>
</hashTree>
</hashTree>
</jmeterTestPlan>
8.2 结果分析脚本
#!/usr/bin/env python3
"""
JMeter结果分析脚本
"""
import pandas as pd
import numpy as np
import matplotlib.pyplot as plt
import argparse
from datetime import datetime
class JmeterResultAnalyzer:
def __init__(self, csv_file):
self.df = pd.read_csv(csv_file)
def analyze(self):
# 基本统计
total_requests = len(self.df)
successful = len(self.df[self.df['responseCode'] == '200'])
failed = total_requests - successful
error_rate = failed / total_requests * 100
# 时间统计 (ms)
response_times = self.df['elapsed'].astype(float)
stats = {
'total_requests': total_requests,
'successful': successful,
'failed': failed,
'error_rate': f"{error_rate:.2f}%",
'min_rt': f"{response_times.min():.2f}ms",
'max_rt': f"{response_times.max():.2f}ms",
'avg_rt': f"{response_times.mean():.2f}ms",
'median_rt': f"{response_times.median():.2f}ms",
'p90_rt': f"{response_times.quantile(0.90):.2f}ms",
'p95_rt': f"{response_times.quantile(0.95):.2f}ms",
'p99_rt': f"{response_times.quantile(0.99):.2f}ms",
}
return stats
def print_report(self):
stats = self.analyze()
print("\n" + "="*60)
print(" JMeter 压 测 结 果 分 析 报 告")
print("="*60)
print(f"\n【请求统计】")
print(f" 总请求数: {stats['total_requests']}")
print(f" 成功请求: {stats['successful']}")
print(f" 失败请求: {stats['failed']}")
print(f" 错误率: {stats['error_rate']}")
print(f"\n【响应时间统计】")
print(f" 最小响应时间: {stats['min_rt']}")
print(f" 平均响应时间: {stats['avg_rt']}")
print(f" 中位数: {stats['median_rt']}")
print(f" 90%分位: {stats['p90_rt']}")
print(f" 95%分位: {stats['p95_rt']}")
print(f" 99%分位: {stats['p99_rt']}")
print(f" 最大响应时间: {stats['max_rt']}")
# TPS计算
duration_sec = (pd.to_datetime(self.df['timeStamp'].iloc[-1]) -
pd.to_datetime(self.df['timeStamp'].iloc[0])).total_seconds()
tps = len(self.df) / duration_sec if duration_sec > 0 else 0
print(f"\n【吞吐量】")
print(f" 测试时长: {duration_sec:.2f}秒")
print(f" TPS: {tps:.2f} req/s")
print("="*60 + "\n")
return stats
if __name__ == "__main__":
parser = argparse.ArgumentParser(description='JMeter结果分析')
parser.add_argument('csv_file', help='JMeter CSV结果文件路径')
args = parser.parse_args()
analyzer = JmeterResultAnalyzer(args.csv_file)
analyzer.print_report()
8.3 测试结果报告示例
================================================================
JMeter 压 测 结 果 分 析 报 告
================================================================
【测试配置】
目标地址: doc-api.example.com:8080
测试接口: POST /api/v1/doc/parse
线程数: 100
启动时间: 10秒
持续时间: 300秒
【请求统计】
总请求数: 375,000
成功请求: 374,925
失败请求: 75
错误率: 0.02%
【响应时间统计】
最小响应时间: 15ms
平均响应时间: 85ms
中位数: 72ms
90%分位: 120ms
95%分位: 150ms
99%分位: 200ms
最大响应时间: 450ms
【吞吐量】
测试时长: 300.00秒
TPS: 1250.00 req/s
【性能评估】
✓ TPS达到1250,超过目标1000
✓ 99%分位响应时间200ms,符合要求
✓ 错误率0.02%,在可接受范围内
⚠ 建议继续观察GC日志,优化内存使用
【优化建议】
1. 当前CPU利用率65%,可考虑增加线程数到120
2. 增大堆外内存配置,减少GC频率
3. 开启连接池预热,减少冷启动影响
================================================================
9.1 核心要点回顾
本章节详细介绍了文档智能解析审核系统的性能优化与压力测试,主要内容包括:
- **JVM调优与GC优化**
- 深入理解JVM内存模型
- 掌握G1 GC配置和参数优化
- 学会分析和解读GC日志
- **连接池配置**
- HikariCP、Redis、Jedis、HTTP连接池的详细配置
- 连接池大小计算和调优方法
- 连接泄漏检测和预防
- **缓存优化**
- 多级缓存架构设计
- Caffeine本地缓存配置
- Redis分布式缓存优化
- **JMeter压力测试**
- 测试计划配置和脚本编写
- 测试结果分析和报告生成
- 性能瓶颈识别和优化建议
9.2 性能优化 Checklist
□ JVM配置
□ 堆大小: -Xms=-Xmx
□ NewRatio设置
□ G1 GC参数
□ GC日志配置
□ 连接池
□ 数据库连接池大小
□ Redis连接池配置
□ HTTP连接池配置
□ 缓存
□ 本地缓存配置
□ 缓存命中率监控
□ 缓存预热策略
□ 监控
□ Micrometer指标
□ Prometheus采集
□ Grafana可视化
□ 压力测试
□ 测试计划编写
□ 结果分析
□ 性能基线建立
9.3 下章预告
通过本章节的学习,您已掌握完整的性能优化和压力测试技能。后续可以继续学习:
- 服务网格(Service Mesh)在微服务架构中的应用
- 容器化和Kubernetes编排实现自动扩缩容
- 全链路压测和混沌工程
*版权声明:本文为洛水石原创技术文章,版权所有,未经许可禁止转载。*

AtomGit 是由开放原子开源基金会联合 CSDN 等生态伙伴共同推出的新一代开源与人工智能协作平台。平台坚持“开放、中立、公益”的理念,把代码托管、模型共享、数据集托管、智能体开发体验和算力服务整合在一起,为开发者提供从开发、训练到部署的一站式体验。
更多推荐


 5
5 0
0- 0


 已为社区贡献68条内容

所有评论(0)