第八章 分类 KNN: 社交网络平台汽车广告精准营销
·
第八章 分类 案例1:社交网络平台汽车广告精准营销
案例背景
本案例中使用的数据集包含年龄、工资和购买特定汽车的决定。案例中将简单使用KNN算法来预测某个特定的人是否会买车
数据读取
import numpy as np
import os
import matplotlib.pyplot as plt
import pandas as pd
import seaborn as sns
from sklearn.model_selection import train_test_split
from sklearn.preprocessing import StandardScaler
from matplotlib.colors import ListedColormap
from sklearn.neighbors import KNeighborsClassifier
from sklearn.metrics import confusion_matrix,classification_report,accuracy_score
import warnings
warnings.filterwarnings('ignore')
plt.style.use('fivethirtyeight')
dataset=pd.read_csv('./Social_Network_Ads.csv')
dataset.head(2)
| User ID | Gender | Age | EstimatedSalary | Purchased | |
|---|---|---|---|---|---|
| 0 | 15624510 | Male | 19 | 19000 | 0 |
| 1 | 15810944 | Male | 35 | 20000 | 0 |
dataset.describe().T
| count | mean | std | min | 25% | 50% | 75% | max | |
|---|---|---|---|---|---|---|---|---|
| User ID | 400.0 | 1.569154e+07 | 71658.321581 | 15566689.0 | 15626763.75 | 15694341.5 | 15750363.0 | 15815236.0 |
| Age | 400.0 | 3.765500e+01 | 10.482877 | 18.0 | 29.75 | 37.0 | 46.0 | 60.0 |
| EstimatedSalary | 400.0 | 6.974250e+04 | 34096.960282 | 15000.0 | 43000.00 | 70000.0 | 88000.0 | 150000.0 |
| Purchased | 400.0 | 3.575000e-01 | 0.479864 | 0.0 | 0.00 | 0.0 | 1.0 | 1.0 |
平均年龄大概37岁,平均工资69742$
f,ax=plt.subplots(1,2,figsize=(18,8))
dataset['Gender'].value_counts().plot.pie(explode=[0,0.05],autopct='%1.1f%%',ax=ax[0],shadow=True)
ax[0].set_title('Purchase by Gender')
ax[0].set_ylabel('Count')
sns.countplot('Gender',data=dataset,ax=ax[1],order=dataset['Gender'].value_counts().index)
ax[1].set_title('Purchase by Gender')
plt.show()
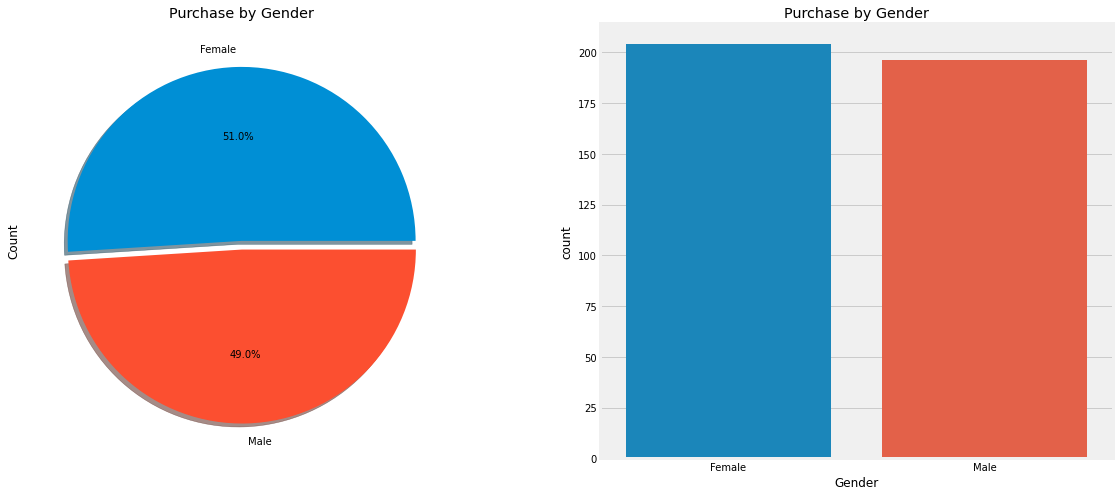
看出男女比较平等(男女数量相当)
分析薪资分布
fig=plt.gcf()
fig.set_size_inches(10,7)
fig=sns.distplot(dataset['EstimatedSalary'],kde=True,bins=50)
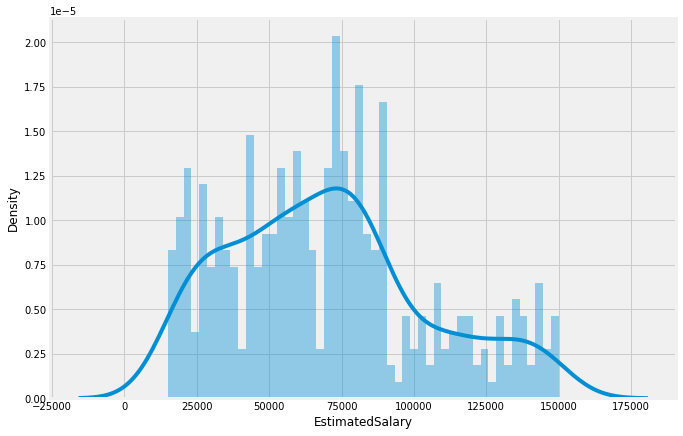
我们看到人群的平均工资大概是70000$
f,ax=plt.subplots(1,2,figsize=(18,8))
dataset['Purchased'].value_counts().plot.pie(explode=[0,0.05],autopct='%1.1f%%',ax=ax[0],shadow=True)
ax[0].set_title('Purchase Distribution')
ax[0].set_ylabel('Count')
sns.countplot('Purchased',data=dataset,ax=ax[1],order=dataset['Purchased'].value_counts().index)
ax[1].set_title('Purchase Distribution')
plt.show()
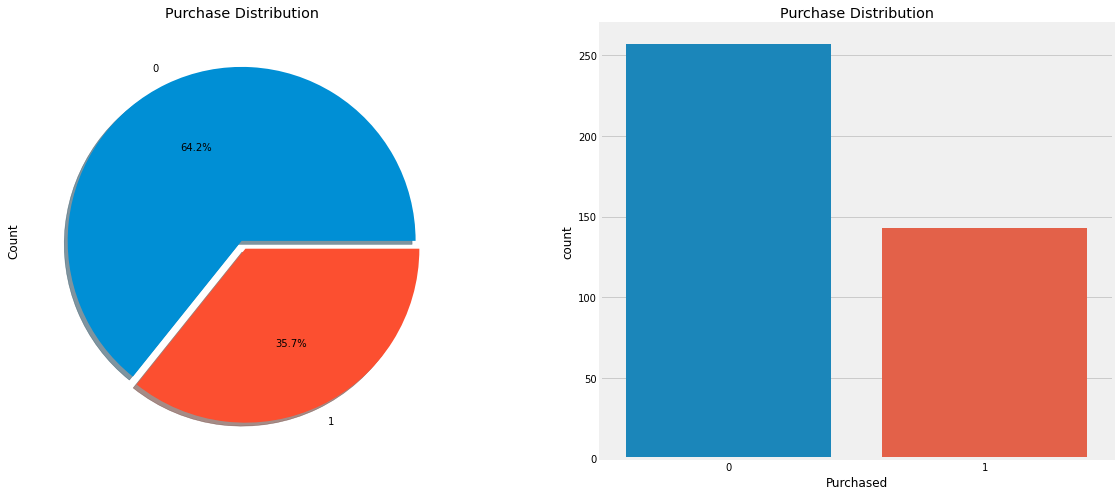
所以数据集中的大多数人都没有买车。
我们的一切努力都应该是为了销售更多的汽车。
模型构建与训练
X=dataset.iloc[:,[2,3]].values
y=dataset.iloc[:,4].values
X_train,X_test,y_train,y_test=train_test_split(X,y,test_size=0.2,random_state=0)
X_train=StandardScaler().fit_transform(X_train)
X_test=StandardScaler().fit_transform(X_test)
classifier=KNeighborsClassifier(n_neighbors=1,metric='minkowski',p=2)
classifier.fit(X_train,y_train)
KNeighborsClassifier(n_neighbors=1)In a Jupyter environment, please rerun this cell to show the HTML representation or trust the notebook.
On GitHub, the HTML representation is unable to render, please try loading this page with nbviewer.org.
KNeighborsClassifier(n_neighbors=1)
y_pred=classifier.predict(X_test)
cm=confusion_matrix(y_test,y_pred)
f, ax = plt.subplots(figsize =(5,5))
sns.heatmap(cm,annot = True,linewidths=0.5,linecolor="red",fmt = ".0f",ax=ax)
plt.title("Test for Test Dataset")
plt.xlabel("predicted y values")
plt.ylabel("real y values")
plt.show()
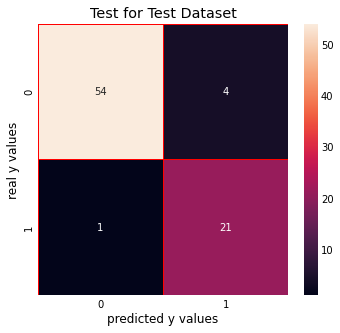
print(accuracy_score(y_test,y_pred))
0.925
模型参数调优
error_rate=[]

for i in range(1,40):
    knn=KNeighborsClassifier(n_neighbors=i)
    knn.fit(X_train,y_train)
    pred_i=knn.predict(X_test)
    error_rate.append(np.mean(pred_i != y_test))
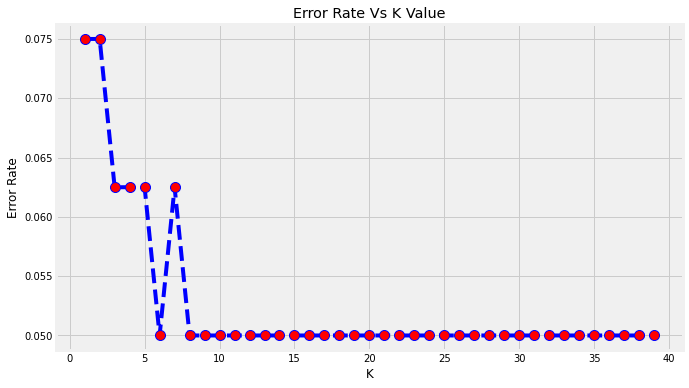
plt.figure(figsize=(10,6))
plt.plot(range(1,40),error_rate,color='blue',linestyle='dashed',marker='o',markerfacecolor='red',markersize=10)
plt.title('Error Rate Vs K Value')
plt.xlabel('K')
plt.ylabel('Error Rate')
plt.show()
classifier=KNeighborsClassifier(n_neighbors=5,metric='minkowski',p=2)
classifier.fit(X_train,y_train)
KNeighborsClassifier()In a Jupyter environment, please rerun this cell to show the HTML representation or trust the notebook.
On GitHub, the HTML representation is unable to render, please try loading this page with nbviewer.org.
KNeighborsClassifier()
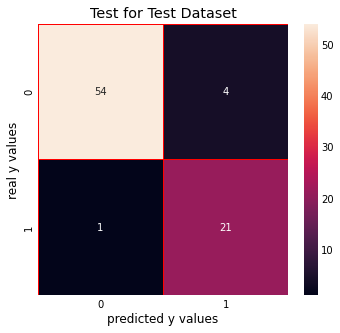
y_pred=classifier.predict(X_test)
cm=confusion_matrix(y_test,y_pred)
f, ax = plt.subplots(figsize =(5,5))
sns.heatmap(cm,annot = True,linewidths=0.5,linecolor="red",fmt = ".0f",ax=ax)
plt.title("Test for Test Dataset")
plt.xlabel("predicted y values")
plt.ylabel("real y values")
plt.show()
print(accuracy_score(y_test,y_pred))
0.9375

AtomGit 是由开放原子开源基金会联合 CSDN 等生态伙伴共同推出的新一代开源与人工智能协作平台。平台坚持“开放、中立、公益”的理念,把代码托管、模型共享、数据集托管、智能体开发体验和算力服务整合在一起,为开发者提供从开发、训练到部署的一站式体验。
更多推荐



 6
6 0
0- 0


 已为社区贡献9条内容

所有评论(0)