ESRI 10 米年度全球土地覆盖数据集(2017–2024)
ESRI 10 米年度土地覆盖(2017–2024)
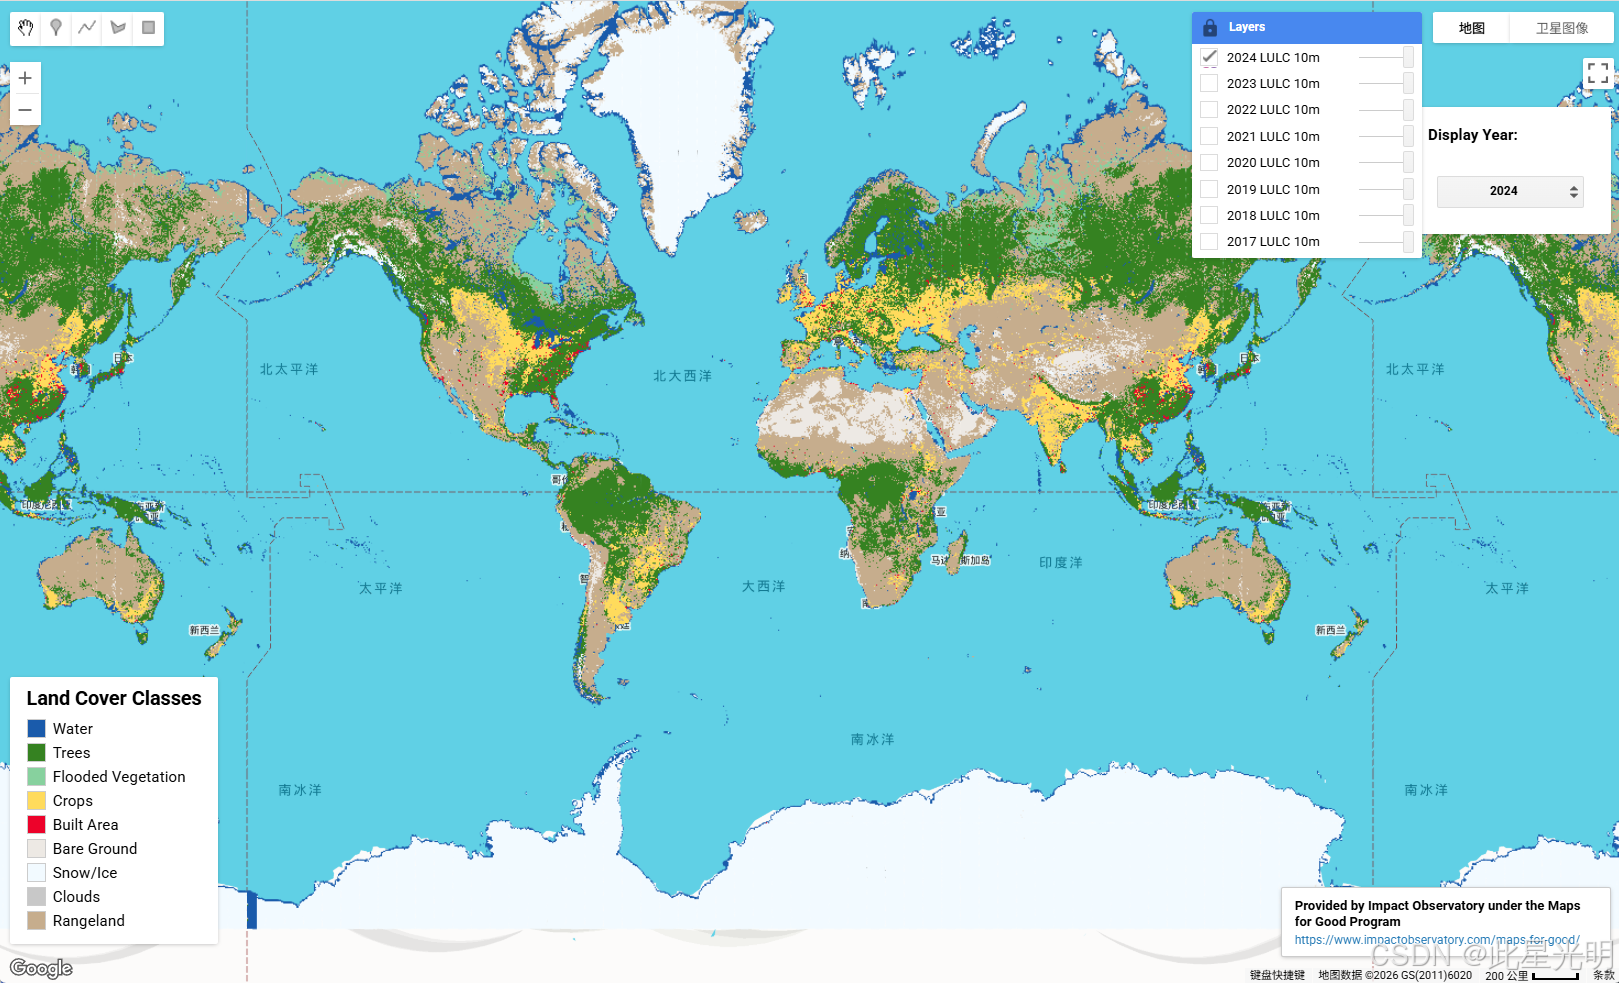
全球年度土地利用与土地覆盖(LULC)时间序列地图已更新至 v3 版本,包含 2017–2024 年的全球 10 米分辨率土地覆盖数据。这些地图基于 ESA Sentinel‑2 的 10 米分辨率影像生成。每幅地图是一年内 9 个土地覆盖类别预测结果的合成图,以生成每一年的代表性快照。该数据集由 Impact Observatory 生产,使用了数十亿个人工标注的像素(由国家地理学会策划)来训练深度学习模型用于土地分类。全球地图是通过将该模型应用于 Planetary Computer 上的 Sentinel‑2 年度场景集合而生成的。每幅地图的平均评估精度均超过 75%。这些由 Impact Observatory 生产、Esri 许可的数据集是从 Impact Observatory 获取的。
本地图使用了相比 10 类别模型更新后的模型,将原来的草地(原类别 3)和灌木(原类别 6)合并为单一的 Rangeland(类别 11)。原始的 Esri 2020 土地覆盖集合使用 10 个类别(草地和灌木分开)以及一个较旧版本的底层深度学习模型。Esri 2020 土地覆盖地图同样由 Impact Observatory 生产,您可以在 GEE 中找到它。该地图仍然可用于现有应用。新的应用应使用本集合中提供的更新版 2020 年数据(一旦可用),尤其是在使用本时间序列中多个年份的数据时,以确保分类一致性。
您可以从首次发布的内容中找到更多信息:Kontgis, C. (2021, June 24). Mapping the world in unprecedented detail。
引用
Karra, Kontgis, et al. “Global land use/land cover with Sentinel-2 and deep learning.”
IGARSS 2021-2021 IEEE International Geoscience and Remote Sensing Symposium. IEEE, 2021.10m_lulc_ts
类别定义 
-
水体:全年主要以水为主的区域;可能不涵盖零星或季节性水体区域;几乎没有稀疏植被,无岩石露头,也没有码头等人工建筑;例如:河流、池塘、湖泊、海洋、洪水盐滩。
-
树木:任何显著的密集高大植被(约 15 英尺或更高)聚集区,通常具有郁闭或较密的冠层;例如:木本植被、热带草原内密集的高大植被丛、种植园、沼泽或红树林(具有季节性水体或冠层过厚无法探测到下方水体的区域)。
-
洪泛植被:全年大部分时间明显有水体混合的各类植被区域;季节性洪泛区,为草/灌木/树木/裸地的混合;例如:洪泛红树林、挺水植被、水稻田以及其他高度灌溉和淹没的农业区。
-
作物:人工种植/规划的谷物、草类和未达到树木高度的作物;例如:玉米、小麦、大豆、结构化的休耕土地。
-
人工地表:人造构筑物;主要道路和铁路网;大型均质不透水面,包括停车场、办公楼和住宅;例如:房屋、密集的村庄/乡镇/城市、铺装道路、沥青。
-
裸地:全年植被非常稀疏或无植被的岩石或土壤区域;无植被或植被稀少的大面积沙地和沙漠;例如:裸露岩石或土壤、沙漠和沙丘、干盐滩/盐沼、干涸湖床、矿山。
-
冰雪:大面积均质的永久性雪或冰区域,通常仅出现在山区或高纬度地区;例如:冰川、永久积雪区、雪原。
-
云:由于持续云覆盖而无土地覆盖信息。
-
放牧地:覆盖均质草本的开放区域,几乎没有较高的植被;野生禾本科植物和草本植物,无明显人工规划(即不是规划农田);例如:天然草甸和树木稀疏至无树的田野、稀疏至无树的开放热带草原、公园/高尔夫球场/草坪、牧场。景观上散布着小丛植物或单株植物并显示出裸露土壤或岩石的混合区域;茂密森林内灌丛空地,明显不高于树木;例如:中等至稀疏覆盖的灌木、灌丛和草丛,草本非常稀疏的热带草原、树木或其他植物。
精度评估信息
请访问 ESRI 发布页面获取详细信息。
| 类别值 | 重映射值 | 土地覆盖类别 | 十六进制颜色码 |
|---|---|---|---|
| 1 | 1 | 水体 | #1A5BAB |
| 2 | 2 | 树木 | #358221 |
| 4 | 3 | 洪泛植被 | #87D19E |
| 5 | 4 | 作物 | #FFDB5C |
| 7 | 5 | 人工地表 | #ED022A |
| 8 | 6 | 裸地 | #EDE9E4 |
| 9 | 7 | 冰雪 | #F2FAFF |
| 10 | 8 | 云 | #C8C8C8 |
| 11 | 9 | 放牧地 | #C6AD8D |
Earth Engine 代码片段
var esri_lulc_ts = ee.ImageCollection("projects/sat-io/open-datasets/landcover/ESRI_Global-LULC_10m_TS");
全部代码
// Optimized Earth Engine Land Use Land Cover (LULC) Visualization
// ==============================================================

// Configuration - Easy to modify
var CONFIG = {
  startYear: 2017,
  endYear: 2024,  // Updated to include 2024
  collection: 'projects/sat-io/open-datasets/landcover/ESRI_Global-LULC_10m_TS',

  // Land cover class definitions
  landCover: {
    names: [
      "Water", "Trees", "Flooded Vegetation", "Crops",
      "Built Area", "Bare Ground", "Snow/Ice", "Clouds", "Rangeland"
    ],
    colors: [
      "#1A5BAB", "#358221", "#87D19E", "#FFDB5C",
      "#ED022A", "#EDE9E4", "#F2FAFF", "#C8C8C8", "#C6AD8D"
    ],
    // Original to remapped value mapping
    remapFrom: [1, 2, 4, 5, 7, 8, 9, 10, 11],
    remapTo: [1, 2, 3, 4, 5, 6, 7, 8, 9]
  },

  // Visualization parameters
  visParams: {
    min: 1,
    max: 9
  }
};

// Load the ESRI LULC collection
var esriLulc = ee.ImageCollection(CONFIG.collection);

// Utility Functions
// =================

/**
 * Remaps land cover values to standardized classification
 * @param {ee.Image} image - Input land cover image
 * @returns {ee.Image} Remapped image
 */
function remapLandCover(image) {
  return image.remap(CONFIG.landCover.remapFrom, CONFIG.landCover.remapTo)
              .copyProperties(image, ['system:time_start', 'system:time_end']);
}

/**
 * Creates annual composite for a given year
 * @param {number} year - Year to create composite for
 * @returns {ee.Image} Annual composite image
 */
function createAnnualComposite(year) {
  var startDate = ee.Date.fromYMD(year, 1, 1);
  var endDate = ee.Date.fromYMD(year, 12, 31);

  return esriLulc
    .filterDate(startDate, endDate)
    .mosaic()
    .set('year', year)
    .set('system:time_start', startDate.millis());
}

/**
 * Generates a list of years from start to end (inclusive)
 * @param {number} start - Start year
 * @param {number} end - End year
 * @returns {Array} Array of years
 */
function generateYearList(start, end) {
  var years = [];
  for (var i = start; i <= end; i++) {
    years.push(i);
  }
  return years;
}

// Legend Creation
// ===============

/**
 * Creates a categorical legend panel
 * @param {Object} legendConfig - Configuration object with colors and names
 * @param {string} title - Legend title
 * @returns {ui.Panel} Legend panel
 */
function createCategoricalLegend(legendConfig, title) {
  var panel = ui.Panel({
    style: {
      position: 'bottom-left',
      padding: '8px 15px',
      backgroundColor: 'rgba(255, 255, 255, 1)'
    }
  });

  // Add title
  var legendTitle = ui.Label({
    value: title,
    style: {
      fontWeight: 'bold',
      fontSize: '18px',
      margin: '0 0 8px 0',
      padding: '0'
    }
  });
  panel.add(legendTitle);

  // Create legend rows
  legendConfig.names.forEach(function(name, index) {
    var colorBox = ui.Label({
      style: {
        backgroundColor: legendConfig.colors[index],
        padding: '8px',
        margin: '0 0 4px 0',
        border: '1px solid #ccc'
      }
    });

    var description = ui.Label({
      value: name,
      style: {
        margin: '0 0 4px 6px',
        fontSize: '14px'
      }
    });

    var row = ui.Panel({
      widgets: [colorBox, description],
      layout: ui.Panel.Layout.Flow('horizontal')
    });

    panel.add(row);
  });

  return panel;
}

/**
 * Creates attribution panel for Impact Observatory
 * @returns {ui.Panel} Attribution panel
 */
function createAttributionPanel() {
  var panel = ui.Panel({
    style: {
      position: 'bottom-right',
      padding: '8px 12px',
      backgroundColor: 'rgba(255, 255, 255, 1)',
      border: '1px solid #ccc',
      maxWidth: '300px'
    }
  });

  var attributionText = ui.Label({
    value: 'Provided by Impact Observatory under the Maps for Good Program',
    style: {
      fontSize: '12px',
      margin: '0 0 4px 0',
      fontWeight: 'bold'
    }
  });

  var linkLabel = ui.Label({
    value: 'https://www.impactobservatory.com/maps-for-good/',
    style: {
      fontSize: '11px',
      color: '#1f77b4',
      margin: '0'
    }
  });

  panel.add(attributionText);
  panel.add(linkLabel);

  return panel;
}

// Layer Management
// ================

/**
 * Adds all annual LULC layers to the map
 */
function addLulcLayers() {
  var years = generateYearList(CONFIG.startYear, CONFIG.endYear);

  years.forEach(function(year) {
    var composite = createAnnualComposite(year);
    var remapped = remapLandCover(composite);

    var visParams = {
      min: CONFIG.visParams.min,
      max: CONFIG.visParams.max,
      palette: CONFIG.landCover.colors
    };

    Map.addLayer(
      ee.Image(remapped),
      visParams,
      year + ' LULC 10m',
      false  // Start with layers turned off for better performance
    );
  });
}

/**
 * Sets up layer visibility - shows only the most recent year by default
 */
function setupLayerVisibility() {
  var layers = Map.layers();

  // Turn off all layers first
  for (var i = 0; i < layers.length(); i++) {
    layers.get(i).setShown(false);
  }

  // Show only the most recent year
  if (layers.length() > 0) {
    layers.get(layers.length() - 1).setShown(true);
  }
}

// UI Controls
// ===========

/**
 * Creates a year selector widget
 */
function createYearSelector() {
  var years = generateYearList(CONFIG.startYear, CONFIG.endYear);
  var yearStrings = years.map(function(year) { return year.toString(); });

  var selector = ui.Select({
    items: yearStrings,
    value: CONFIG.endYear.toString(),
    placeholder: 'Select year...',
    onChange: function(year) {
      showOnlyYear(parseInt(year));
    },
    style: {
      position: 'top-right',
      width: '150px'
    }
  });

  var label = ui.Label({
    value: 'Display Year:',
    style: {
      position: 'top-right',
      fontWeight: 'bold',
      margin: '0 0 5px 0'
    }
  });

  var panel = ui.Panel({
    widgets: [label, selector],
    style: {
      position: 'top-right',
      padding: '8px',
      backgroundColor: 'rgba(255, 255, 255, 1)'
    }
  });

  return panel;
}

/**
 * Shows only the layer for the specified year
 * @param {number} year - Year to display
 */
function showOnlyYear(year) {
  var layers = Map.layers();
  var targetLayerName = year + ' LULC 10m';

  for (var i = 0; i < layers.length(); i++) {
    var layer = layers.get(i);
    var layerName = layer.getName();
    layer.setShown(layerName === targetLayerName);
  }
}

// Initialization
// ==============

/**
 * Main initialization function
 */
function initialize() {
  // Clear existing layers and UI
  Map.clear();

  // Set default map view
  Map.setCenter(0, 0, 2);

  // Add legend
  var legend = createCategoricalLegend(CONFIG.landCover, 'Land Cover Classes');
  Map.add(legend);

  // Add attribution panel
  var attribution = createAttributionPanel();
  Map.add(attribution);

  // Add year selector
  var yearSelector = createYearSelector();
  Map.add(yearSelector);

  // Add all LULC layers
  addLulcLayers();

  // Setup initial visibility
  setupLayerVisibility();

  // Add inspector for clicking on map
  Map.onClick(function(coords) {
    var point = ee.Geometry.Point(coords.lon, coords.lat);
    var layers = Map.layers();

    // Find the currently visible layer
    for (var i = 0; i < layers.length(); i++) {
      var layer = layers.get(i);
      if (layer.getShown()) {
        var image = layer.getEeObject();
        var value = image.sample(point, 10).first().get('remapped');

        ee.data.computeValue(value, function(result) {
          if (result !== null && result >= 1 && result <= 9) {
            var className = CONFIG.landCover.names[result - 1];
            print('Land cover at clicked location: ' + className);
          }
        });
        break;
      }
    }
  });

  print('LULC Visualization initialized!');
  print('Years available: ' + CONFIG.startYear + '-' + CONFIG.endYear);
  print('Click on the map to identify land cover types');
}

// Run initialization
initialize();
贡献、署名和许可证
本数据集由 Impact Observatory 为 Esri 生产。© 2021 Esri。本数据集采用 知识共享署名 4.0 国际许可协议(CC BY 4.0) 提供,任何基于该数据集的副本或衍生作品必须附有以下署名:
更新日志
- 2025-07-08:向集合中添加 2024 年 LULC 数据
- 2024-06-07:向集合中添加 2023 年 LULC 数据;更改了示例路径
- 2023-04-10:向集合中添加 2022 年 LULC 数据
GEE 中整理者:Samapriya Roy
关键词:土地覆盖、土地利用、LULC、10米、全球、世界、哨兵、哨兵2、Impact Observatory
最后更新日期:2025-07-08

AtomGit 是由开放原子开源基金会联合 CSDN 等生态伙伴共同推出的新一代开源与人工智能协作平台。平台坚持“开放、中立、公益”的理念,把代码托管、模型共享、数据集托管、智能体开发体验和算力服务整合在一起,为开发者提供从开发、训练到部署的一站式体验。
更多推荐
 11
11 0
0- 0


 已为社区贡献21条内容

所有评论(0)