美国百年土地变迁全景图
模拟的历史与预测(1938–2100)年际LULC及森林林龄数据集——美国本土(CONUS)
过去一个世纪以来,美国本土的景观发生了巨大变化:农业用地、城市扩张、林业活动、湿地排水以及水库建设等,改变了广大区域的土地覆盖。美国地质调查局(USGS)的研究人员利用广泛的历史数据源和空间显式的 FORE-SCE(土地利用变化情景预测)建模框架,生产了一套无缝、年际、全覆盖的土地利用/土地覆盖(LULC)数据集,时间跨度为1938年至2100年,空间分辨率为一致的250米。该数据集将历史回溯重建与基于情景的未来预测相结合。
历史数据集(1938–1992年)以修改后的1992年国家土地覆盖数据库(NLCD)为起点,通过逆向建模,使用14个LULC类别,逐年重建LULC地图。人为活动相关的类别——耕地、干草/牧场、城市、湿地和水库——利用历史数据源进行主动建模,这些数据源包括农业普查、USGS土地覆盖趋势数据、住房密度记录、排水地普查数据以及美国陆军工程兵团国家水坝清单。自然土地覆盖类别(森林、草地、灌丛)则采用被动建模,其在各区域的比例由人为土地利用的变化消长决定,建模涉及84个EPA III级和15个II级生态区。评估结果显示,该数据集与历史数据源吻合良好,仅在模型向更早年份迭代时出现轻微精度下降。
预测数据集(1992–2100年)采用相同的FORE-SCE框架,生成包含17个类别的年际LULC地图,将1992年NLCD基线向前延伸至2100年,涵盖与IPCC排放情景特别报告(SRES)一致的四种情景:A1B、A2、B1和B2。情景需求通过专家研讨会,将IPCC SRES假设降尺度到84个III级生态区,同时结合IMAGE集成模型输出以及历史USGS和NLCD数据。除LULC主题信息外,预测数据集还包含年际森林林龄图层,记录每个森林像元自最近一次干扰或土地利用变化以来的年数。1992年的初始林龄源自基于Landsat的VCT干扰数据以及美国林务局FIA地面调查数据的插值结果。
上述数据集共同提供了1938年至2100年连续、年际的LULC记录,使研究人员能够评估LULC变化对生态和社会过程的历史影响,并探讨其对水文、碳和温室气体通量、生物多样性、气候及生物地球化学循环的潜在未来影响。
主要特征与详细信息
| 特征 | 历史数据集 | 预测数据集 |
|---|---|---|
| 时间段 | 1938–1992(年际) | 1992–2100(年际;基线1992–2005,预测2006–2100) |
| LULC类别 | 14类 | 17类(增加3类皆伐所有权类别) |
| 情景 | 无 | A1B, A2, B1, B2(IPCC SRES) |
| 森林林龄 | 未建模 | 包含(1992–2100) |
| 空间分辨率 | 250米 | 250米 |
| 覆盖范围 | 美国本土 | 美国本土 |
| 空间框架 | 84个III级 + 15个II级 EPA生态区 | 84个III级 EPA生态区 |
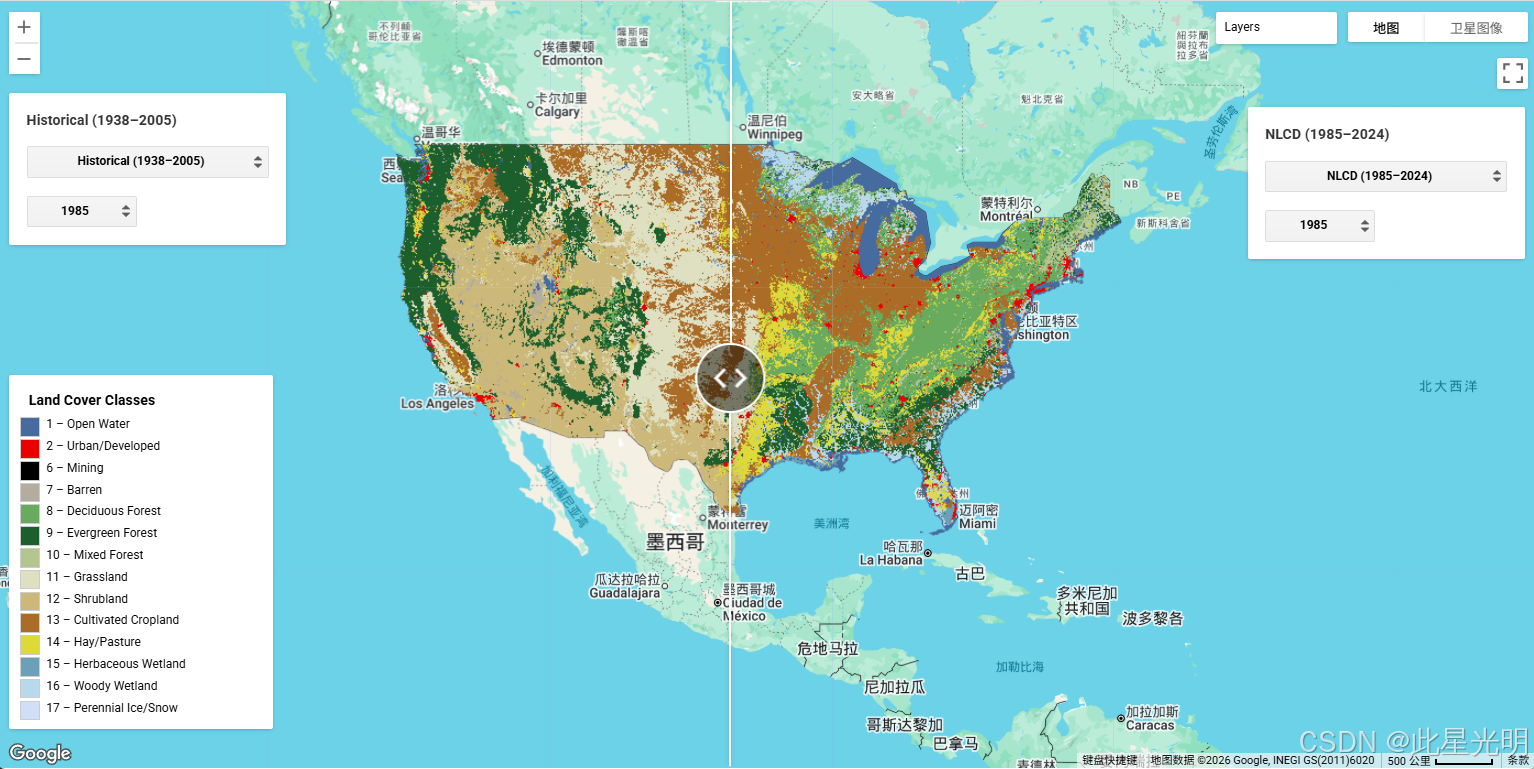
LULC类别(历史,14类): 水体、城市、采矿、裸地、落叶林、常绿林、混交林、草地、灌丛、耕地、干草/牧场、草本湿地、木本湿地、冰雪
LULC类别(预测,17类): 所有历史类别 + 皆伐(国家森林)、皆伐(其他公共)、皆伐(私有);“城市”类别由多个NLCD开发类聚合而成
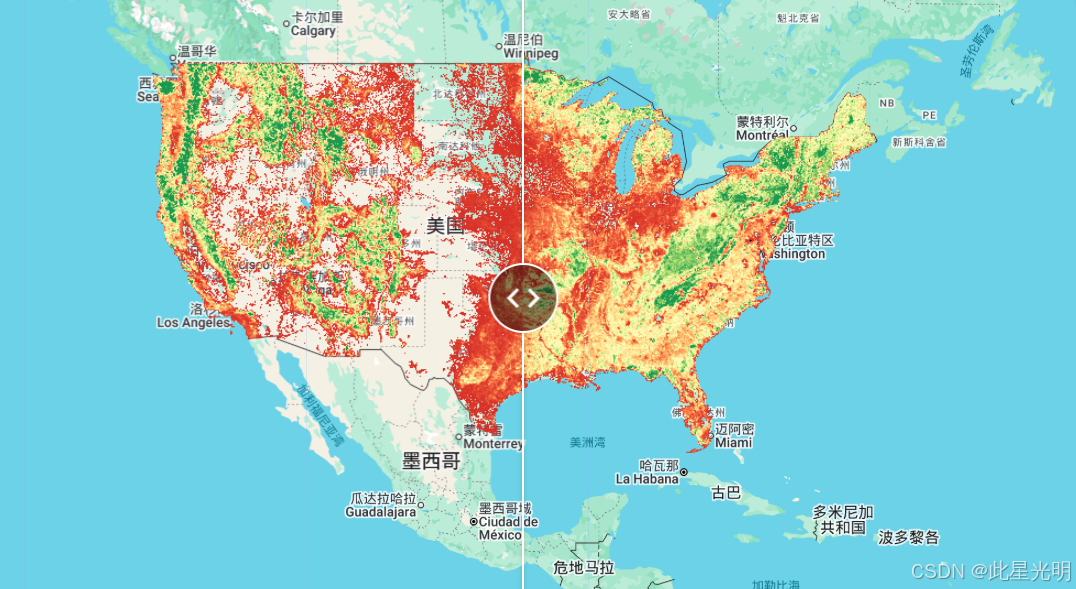
森林林龄: 像元值表示该像元自上次发生土地利用/土地覆盖变化或干扰(皆伐或造林)以来的年数。发生皆伐或造林事件时,林龄重置为零。自然死亡、火灾、风暴破坏和虫害破坏未纳入建模;绝对林龄值最适合解释为随时间推移的相对变化,而非可直接与实地对比的精确林龄。
数据来源
- 历史数据发布:https://doi.org/10.5066/F7KK99RR
- 历史期刊文章:https://doi.org/10.1080/1747423X.2016.1147619
- 预测数据发布:https://doi.org/10.5066/P95AK9HP
- 预测期刊文章:https://doi.org/10.1890/13-1245.1
引用信息
历史土地利用与土地覆盖
数据发布:Sohl, T.L., Reker, Ryan, Bouchard, Michelle, Sayler, Kristi, Dornbierer, Jordan, Wika, Steve, Quenzer, Rob, and Friesz, Aaron, 2018, Modeled historical land use and land cover for the conterminous United States: 1938–1992: U.S. Geological Survey data release, https://doi.org/10.5066/F7KK99RR.
期刊文章:Sohl, T., Reker, R., Bouchard, M., Sayler, K., Dornbierer, J., Wika, S., Quenzer, R., & Friesz, A. (2016). Modeled historical land use and land cover for the conterminous United States. Journal of Land Use Science, 11(4), 476–499. https://doi.org/10.1080/1747423X.2016.1147619
土地利用与土地覆盖预测及森林林龄
数据发布:Sohl, T.L., Sayler, K.L., Bouchard, M.A., Reker, R.R., Freisz, A.M., Bennett, S.L., Sleeter, B.M., Sleeter, R.R., Wilson, T., Soulard, C., Knuppe, M., and Van Hofwegen, T., 2018, Conterminous United States Land Cover Projections — 1992 to 2100: U.S. Geological Survey data release, https://doi.org/10.5066/P95AK9HP.
期刊文章:Sohl, T.L., Sayler, K.L., Bouchard, M.A., Reker, R.R., Freisz, A.M., Bennett, S.L., Sleeter, B.M., Sleeter, R.R., Wilson, T., Soulard, C., Knuppe, M., and Van Hofwegen, T. (2014). Spatially explicit modeling of 1992 to 2100 land cover and forest stand age for the conterminous United States. Ecological Applications, 24(5), 1015–1036. https://doi.org/10.1890/13-1245.1
Earth Engine 代码片段
var lulc_conus = ee.ImageCollection("projects/sat-io/open-datasets/USGS/LULC-CONUS");
var forest_history = ee.ImageCollection("projects/sat-io/open-datasets/USGS/CONUS-FOREST-HISTORY");
示例代码:
// ============================================================
// USGS CONUS LULC & NLCD Land Cover Comparison
// Split-panel map with dataset + year selectors on both sides
// ============================================================

// ----- Data Sources -----
var nlcd = ee.ImageCollection("projects/sat-io/open-datasets/USGS/ANNUAL_NLCD/LANDCOVER"),
    usgsLulc = ee.ImageCollection("projects/sat-io/open-datasets/USGS/LULC-CONUS");


// ----- Dataset definitions -----
var datasets = {
  'Historical (1938–2005)': {source: 'usgs', scenario: 'Historical', years: ee.List.sequence(1938, 2005).getInfo()},
  'Projection B1 (2006–2100)': {source: 'usgs', scenario: 'B1', years: ee.List.sequence(2006, 2100).getInfo()},
  'Projection B2 (2006–2100)': {source: 'usgs', scenario: 'B2', years: ee.List.sequence(2006, 2100).getInfo()},
  'Projection A1B (2006–2100)': {source: 'usgs', scenario: 'A1B', years: ee.List.sequence(2006, 2100).getInfo()},
  'Projection A2 (2006–2100)': {source: 'usgs', scenario: 'A2', years: ee.List.sequence(2006, 2100).getInfo()},
  'NLCD (1985–2024)': {source: 'nlcd', scenario: null, years: ee.List.sequence(1985, 2024).getInfo()}
};
var datasetNames = Object.keys(datasets);

// =============================================
// USGS LULC Classes (1–17, 3/4/5 unused)
// =============================================
var lulcClassValues = [1, 2, 6, 7, 8, 9, 10, 11, 12, 13, 14, 15, 16, 17];
var lulcPalette = [
  '466b9f', //  1 - Open Water
  'eb0000', //  2 - Urban/Developed
  '000000', //  6 - Mining
  'b3ac9f', //  7 - Barren
  '68ab5f', //  8 - Deciduous Forest
  '1c5f2c', //  9 - Evergreen Forest
  'b5c58f', // 10 - Mixed Forest
  'dfdfc2', // 11 - Grassland
  'ccb879', // 12 - Shrubland
  'ab6c28', // 13 - Cultivated Cropland
  'dcd939', // 14 - Hay/Pasture
  '6c9fb8', // 15 - Herbaceous Wetland
  'b8d9eb', // 16 - Woody Wetland
  'd1def8'  // 17 - Perennial Ice/Snow
];
var lulcClassNames = [
  'Open Water',          //  1
  'Urban/Developed',     //  2
  'Mining',              //  6
  'Barren',              //  7
  'Deciduous Forest',    //  8
  'Evergreen Forest',    //  9
  'Mixed Forest',        // 10
  'Grassland',           // 11
  'Shrubland',           // 12
  'Cultivated Cropland', // 13
  'Hay/Pasture',         // 14
  'Herbaceous Wetland',  // 15
  'Woody Wetland',       // 16
  'Perennial Ice/Snow'   // 17
];

// =============================================
// NLCD → USGS LULC class mapping
// =============================================
var nlcdFromValues = [11, 12, 21, 22, 23, 24, 31, 41, 42, 43, 52, 71, 81, 82, 90, 95];
var nlcdToValues   = [ 1, 17,  2,  2,  2,  2,  7,  8,  9, 10, 12, 11, 14, 13, 16, 15];

// ----- Remap helpers -----
function remapUsgs(image) {
  return image.remap(
    lulcClassValues,
    ee.List.sequence(0, lulcClassValues.length - 1)
  );
}

function remapNlcd(image) {
  var unified = image.remap(nlcdFromValues, nlcdToValues);
  return unified.remap(
    lulcClassValues,
    ee.List.sequence(0, lulcClassValues.length - 1)
  );
}

var visParams = {
  min: 0,
  max: lulcClassValues.length - 1,
  palette: lulcPalette
};

// ----- Get image for any dataset + year -----
function getImage(datasetName, year) {
  var ds = datasets[datasetName];
  if (ds.source === 'nlcd') {
    var nlcdImg = nlcd
      .filter(ee.Filter.calendarRange(year, year, 'year'))
      .first().rename('landcover');
    return remapNlcd(nlcdImg);
  } else {
    var usgsImg = usgsLulc
      .filter(ee.Filter.eq('scenario', ds.scenario))
      .filter(ee.Filter.calendarRange(year, year, 'year'))
      .first().rename('landcover');
    return remapUsgs(usgsImg);
  }
}

// ----- Build UI -----
ui.root.clear();

var leftMap = ui.Map();
var rightMap = ui.Map();
var linker = ui.Map.Linker([leftMap, rightMap]);

var splitPanel = ui.SplitPanel({
  firstPanel: leftMap,
  secondPanel: rightMap,
  orientation: 'horizontal',
  wipe: true
});
ui.root.add(splitPanel);
leftMap.setCenter(-98.5, 39.5, 4);

// ----- Reusable panel builder for either side -----
function buildControls(map, position, defaultDataset, defaultYear) {
  var state = {dataset: defaultDataset, year: defaultYear};

  var label = ui.Label('', {fontWeight: 'bold', fontSize: '13px', color: '#333'});

  var yearSelect = ui.Select({items: [], style: {width: '100px'}});

  function updateMap() {
    map.layers().reset();
    var remapped = getImage(state.dataset, state.year);
    map.addLayer(remapped, visParams, state.dataset + ' ' + state.year);
    label.setValue(state.dataset);
  }

  function setYears(datasetName) {
    var years = datasets[datasetName].years;
    yearSelect.items().reset(years.map(String));
    // Pick closest valid year
    var yr = state.year;
    if (years.indexOf(yr) === -1) {
      yr = years[0];
    }
    state.year = yr;
    yearSelect.setValue(String(yr), false);
  }

  var datasetSelect = ui.Select({
    items: datasetNames,
    value: defaultDataset,
    onChange: function(val) {
      state.dataset = val;
      setYears(val);
      updateMap();
    },
    style: {width: '220px'}
  });

  yearSelect.onChange(function(val) {
    state.year = parseInt(val, 10);
    updateMap();
  });

  // Initialize
  setYears(defaultDataset);
  yearSelect.setValue(String(defaultYear), false);

  var panel = ui.Panel({
    widgets: [label, datasetSelect, yearSelect],
    style: {position: position, padding: '8px'}
  });
  map.add(panel);

  updateMap();
}

// Left panel: default to Historical 1985
buildControls(leftMap, 'top-left', 'Historical (1938–2005)', 1985);

// Right panel: default to NLCD 1985
buildControls(rightMap, 'top-right', 'NLCD (1985–2024)', 1985);

// ----- Legend -----
function buildLegend(title, classValues, classNames, palette) {
  var panel = ui.Panel({style: {padding: '6px 10px', width: '240px'}});
  panel.add(ui.Label(title, {fontWeight: 'bold', fontSize: '13px'}));
  for (var i = 0; i < classValues.length; i++) {
    var colorBox = ui.Label('', {
      backgroundColor: '#' + palette[i],
      padding: '8px',
      margin: '0 6px 2px 0',
      border: '1px solid #ccc'
    });
    var lbl = ui.Label(classValues[i] + ' – ' + classNames[i], {
      fontSize: '11px',
      margin: '0 0 2px 0'
    });
    panel.add(ui.Panel([colorBox, lbl], ui.Panel.Layout.Flow('horizontal')));
  }
  return panel;
}

var legend = buildLegend('Land Cover Classes', lulcClassValues, lulcClassNames, lulcPalette);
legend.style().set('position', 'bottom-left');
leftMap.add(legend);

print('Drag the center slider to compare. Use dropdowns to pick any dataset and year on either side.');
/**
 * CONUS Forest Disturbance History Viewer
 * Compares historical (1992-2005) and projected (2006-2100) forest disturbance
 * Scenarios: A1B, A2, B1, B2 (SRES emission scenarios)
 *
 * Pixel values represent the number of years since that pixel last
 * experienced a land-use or land-cover change.
 *
 * Data source: USGS CONUS Forest History
 * Asset: projects/nwi-usgs/assets/USGS-CONUS-ForestHistory
 */

// ============================================================================
// Configuration
// ============================================================================
var ASSET_PATH = 'projects/sat-io/open-datasets/USGS/CONUS-FOREST-HISTORY';
var HISTORICAL_START = 1992;
var HISTORICAL_END = 2005;
var PROJECTED_START = 2006;
var PROJECTED_END = 2100;

// ============================================================================
// Load Image Collection
// ============================================================================
var forestHistory = ee.ImageCollection(ASSET_PATH);

// Print collection info
print('Forest History Collection:', forestHistory.size());

// ============================================================================
// Helper Functions
// ============================================================================

/**
 * Get image by scenario and year
 */
function getImage(scenario, year) {
  var assetName;
  if (scenario === 'historical') {
    assetName = 'historical_forest_history_y' + year;
  } else {
    assetName = scenario + '_forest_history_y' + year;
  }
  var image = ee.Image(ASSET_PATH + '/' + assetName);
  // Mask out zero pixels (no data/background)
  return image.updateMask(image.neq(0));
}

/**
 * Get scenario label for display
 */
function getScenarioLabel(scenario) {
  var labels = {
    'historical': 'Historical',
    'a1b': 'A1B (Balanced Growth)',
    'a2': 'A2 (Regional Development)',
    'b1': 'B1 (Environmental Focus)',
    'b2': 'B2 (Local Solutions)'
  };
  return labels[scenario] || scenario;
}

// ============================================================================
// Visualization Parameters
// ============================================================================

// Years since last land-use/land-cover change visualization
var visParams = {
  min: 1,
  max: 100,
  palette: [
    '#d73027',  // Recent change (1 year)
    '#f46d43',
    '#fdae61',
    '#fee08b',
    '#ffffbf',  // Mid-range
    '#d9ef8b',
    '#a6d96a',
    '#66bd63',
    '#1a9850'   // Long time since change (100+ years)
  ]
};

// ============================================================================
// UI Setup
// ============================================================================

// Clear default map
ui.root.clear();

// Create split panel layout
var leftMap = ui.Map();
var rightMap = ui.Map();

// Link the maps
var linker = ui.Map.Linker([leftMap, rightMap]);

// Create split panel
var splitPanel = ui.SplitPanel({
  firstPanel: leftMap,
  secondPanel: rightMap,
  orientation: 'horizontal',
  wipe: true
});

// ============================================================================
// Control Panel
// ============================================================================

var controlPanel = ui.Panel({
  style: {
    width: '320px',
    padding: '10px',
    backgroundColor: '#f8f9fa'
  }
});

// Title
controlPanel.add(ui.Label({
  value: '🌲 Forest Disturbance Viewer',
  style: {
    fontSize: '20px',
    fontWeight: 'bold',
    margin: '0 0 10px 0'
  }
}));

// Description
controlPanel.add(ui.Label({
  value: 'Compare historical and projected CONUS forest disturbance patterns.',
  style: {fontSize: '12px', color: '#666', margin: '0 0 15px 0'}
}));

// ---- Left Panel Controls ----
controlPanel.add(ui.Label({
  value: '◀ LEFT PANEL',
  style: {fontWeight: 'bold', fontSize: '14px', margin: '10px 0 5px 0'}
}));

// Left scenario selector
var leftScenarioSelect = ui.Select({
  items: [
    {label: 'Historical (1992-2005)', value: 'historical'},
    {label: 'A1B - Balanced Growth', value: 'a1b'},
    {label: 'A2 - Regional Development', value: 'a2'},
    {label: 'B1 - Environmental Focus', value: 'b1'},
    {label: 'B2 - Local Solutions', value: 'b2'}
  ],
  value: 'historical',
  style: {stretch: 'horizontal'}
});
controlPanel.add(ui.Label('Scenario:', {fontSize: '12px'}));
controlPanel.add(leftScenarioSelect);

// Left year slider
var leftYearSlider = ui.Slider({
  min: HISTORICAL_START,
  max: HISTORICAL_END,
  value: 2000,
  step: 1,
  style: {stretch: 'horizontal'}
});
var leftYearLabel = ui.Label('Year: 2000', {fontSize: '12px'});
controlPanel.add(leftYearLabel);
controlPanel.add(leftYearSlider);

// ---- Right Panel Controls ----
controlPanel.add(ui.Label({
  value: '▶ RIGHT PANEL',
  style: {fontWeight: 'bold', fontSize: '14px', margin: '20px 0 5px 0'}
}));

// Right scenario selector
var rightScenarioSelect = ui.Select({
  items: [
    {label: 'Historical (1992-2005)', value: 'historical'},
    {label: 'A1B - Balanced Growth', value: 'a1b'},
    {label: 'A2 - Regional Development', value: 'a2'},
    {label: 'B1 - Environmental Focus', value: 'b1'},
    {label: 'B2 - Local Solutions', value: 'b2'}
  ],
  value: 'a1b',
  style: {stretch: 'horizontal'}
});
controlPanel.add(ui.Label('Scenario:', {fontSize: '12px'}));
controlPanel.add(rightScenarioSelect);

// Right year slider
var rightYearSlider = ui.Slider({
  min: PROJECTED_START,
  max: PROJECTED_END,
  value: 2050,
  step: 1,
  style: {stretch: 'horizontal'}
});
var rightYearLabel = ui.Label('Year: 2050', {fontSize: '12px'});
controlPanel.add(rightYearLabel);
controlPanel.add(rightYearSlider);

// ---- Difference Mode ----
controlPanel.add(ui.Label({
  value: '⚡ ANALYSIS',
  style: {fontWeight: 'bold', fontSize: '14px', margin: '20px 0 5px 0'}
}));

var showDifferenceCheck = ui.Checkbox('Show Change Detection', false);
controlPanel.add(showDifferenceCheck);

// ============================================================================
// Legend
// ============================================================================

controlPanel.add(ui.Label({
  value: '📊 LEGEND',
  style: {fontWeight: 'bold', fontSize: '14px', margin: '20px 0 5px 0'}
}));

controlPanel.add(ui.Label({
  value: 'Years Since Last Change',
  style: {fontSize: '11px', fontWeight: 'bold', margin: '5px 0 2px 0'}
}));

// Create colorbar
var colorbarPanel = ui.Panel({
  style: {margin: '5px 0'}
});

// Gradient bar using multiple color segments
var gradientColors = ['#d73027', '#f46d43', '#fdae61', '#fee08b', '#ffffbf', '#d9ef8b', '#a6d96a', '#66bd63', '#1a9850'];
var colorBar = ui.Thumbnail({
  image: ee.Image.pixelLonLat().select(0),
  params: {
    bbox: [0, 0, 1, 0.1],
    dimensions: '250x15',
    format: 'png',
    min: 0,
    max: 1,
    palette: gradientColors
  },
  style: {stretch: 'horizontal', margin: '0 0 4px 0'}
});
colorbarPanel.add(colorBar);

// Labels for colorbar
var labelPanel = ui.Panel({
  widgets: [
    ui.Label('1', {fontSize: '10px', margin: '0'}),
    ui.Label('25', {fontSize: '10px', margin: '0 auto'}),
    ui.Label('50', {fontSize: '10px', margin: '0 auto'}),
    ui.Label('75', {fontSize: '10px', margin: '0 auto'}),
    ui.Label('100+', {fontSize: '10px', margin: '0'})
  ],
  layout: ui.Panel.Layout.Flow('horizontal'),
  style: {stretch: 'horizontal'}
});
colorbarPanel.add(labelPanel);

controlPanel.add(colorbarPanel);

controlPanel.add(ui.Label({
  value: 'Lower values = recent change\nHigher values = stable over time',
  style: {fontSize: '10px', color: '#666', whiteSpace: 'pre', margin: '5px 0'}
}));

// Change detection legend
var changeLegendPanel = ui.Panel({
  style: {margin: '5px 0', shown: false}
});
changeLegendPanel.add(ui.Label('Change Detection:', {fontWeight: 'bold', fontSize: '12px'}));

var changeItems = [
  {color: '#d73027', label: 'Forest Loss'},
  {color: '#fee090', label: 'No Change'},
  {color: '#1a9850', label: 'Forest Gain'}
];

changeItems.forEach(function(item) {
  var row = ui.Panel({
    widgets: [
      ui.Label({
        style: {
          backgroundColor: item.color,
          padding: '8px',
          margin: '2px 8px 2px 0'
        }
      }),
      ui.Label(item.label, {fontSize: '11px'})
    ],
    layout: ui.Panel.Layout.Flow('horizontal')
  });
  changeLegendPanel.add(row);
});

controlPanel.add(changeLegendPanel);

// ============================================================================
// Info Panel
// ============================================================================

controlPanel.add(ui.Label({
  value: 'ℹ️ INFO',
  style: {fontWeight: 'bold', fontSize: '14px', margin: '20px 0 5px 0'}
}));

controlPanel.add(ui.Label({
  value: 'SRES Scenarios:\n• A1B: Rapid economic growth, balanced energy\n• A2: Regional development, slower growth\n• B1: Environmental sustainability focus\n• B2: Local solutions, heterogeneous world',
  style: {fontSize: '10px', color: '#666', whiteSpace: 'pre'}
}));

// ============================================================================
// Update Functions
// ============================================================================

function updateLeftYearRange() {
  var scenario = leftScenarioSelect.getValue();
  if (scenario === 'historical') {
    leftYearSlider.setMin(HISTORICAL_START);
    leftYearSlider.setMax(HISTORICAL_END);
    if (leftYearSlider.getValue() > HISTORICAL_END) {
      leftYearSlider.setValue(HISTORICAL_END);
    }
    if (leftYearSlider.getValue() < HISTORICAL_START) {
      leftYearSlider.setValue(HISTORICAL_START);
    }
  } else {
    leftYearSlider.setMin(PROJECTED_START);
    leftYearSlider.setMax(PROJECTED_END);
    if (leftYearSlider.getValue() < PROJECTED_START) {
      leftYearSlider.setValue(PROJECTED_START);
    }
  }
}

function updateRightYearRange() {
  var scenario = rightScenarioSelect.getValue();
  if (scenario === 'historical') {
    rightYearSlider.setMin(HISTORICAL_START);
    rightYearSlider.setMax(HISTORICAL_END);
    if (rightYearSlider.getValue() > HISTORICAL_END) {
      rightYearSlider.setValue(HISTORICAL_END);
    }
    if (rightYearSlider.getValue() < HISTORICAL_START) {
      rightYearSlider.setValue(HISTORICAL_START);
    }
  } else {
    rightYearSlider.setMin(PROJECTED_START);
    rightYearSlider.setMax(PROJECTED_END);
    if (rightYearSlider.getValue() < PROJECTED_START) {
      rightYearSlider.setValue(PROJECTED_START);
    }
  }
}

function updateMaps() {
  var leftScenario = leftScenarioSelect.getValue();
  var leftYear = Math.round(leftYearSlider.getValue());
  var rightScenario = rightScenarioSelect.getValue();
  var rightYear = Math.round(rightYearSlider.getValue());

  // Update labels
  leftYearLabel.setValue('Year: ' + leftYear);
  rightYearLabel.setValue('Year: ' + rightYear);

  // Get images
  var leftImage = getImage(leftScenario, leftYear);
  var rightImage = getImage(rightScenario, rightYear);

  // Clear layers
  leftMap.layers().reset();
  rightMap.layers().reset();

  // Check if showing difference
  var showDiff = showDifferenceCheck.getValue();

  if (showDiff) {
    // Change detection visualization
    var changeVisParams = {
      min: -5,
      max: 5,
      palette: ['#d73027', '#fc8d59', '#fee090', '#e0f3f8', '#91bfdb', '#4575b4', '#1a9850']
    };

    var difference = rightImage.subtract(leftImage);

    leftMap.addLayer(leftImage, visParams, getScenarioLabel(leftScenario) + ' ' + leftYear);
    rightMap.addLayer(difference, changeVisParams, 'Change: ' + leftYear + ' → ' + rightYear);

    changeLegendPanel.style().set('shown', true);
  } else {
    leftMap.addLayer(leftImage, visParams, getScenarioLabel(leftScenario) + ' ' + leftYear);
    rightMap.addLayer(rightImage, visParams, getScenarioLabel(rightScenario) + ' ' + rightYear);

    changeLegendPanel.style().set('shown', false);
  }
}

// ============================================================================
// Event Handlers
// ============================================================================

leftScenarioSelect.onChange(function() {
  updateLeftYearRange();
  updateMaps();
});

rightScenarioSelect.onChange(function() {
  updateRightYearRange();
  updateMaps();
});

leftYearSlider.onChange(updateMaps);
rightYearSlider.onChange(updateMaps);
showDifferenceCheck.onChange(updateMaps);

// ============================================================================
// Initialize
// ============================================================================

// Set up UI layout
ui.root.add(controlPanel);
ui.root.add(splitPanel);

// Center on CONUS
leftMap.setCenter(-98.5, 39.8, 4);
rightMap.setCenter(-98.5, 39.8, 4);

// Initial update
updateMaps();

// Add map titles
leftMap.add(ui.Label({
  value: '◀ Historical / Reference',
  style: {
    position: 'top-center',
    backgroundColor: 'rgba(255,255,255,0.8)',
    padding: '5px 10px',
    fontSize: '14px',
    fontWeight: 'bold'
  }
}));

rightMap.add(ui.Label({
  value: '▶ Projected / Comparison',
  style: {
    position: 'top-center',
    backgroundColor: 'rgba(255,255,255,0.8)',
    padding: '5px 10px',
    fontSize: '14px',
    fontWeight: 'bold'
  }
}));

print('Forest Disturbance Viewer loaded successfully!');
print('Historical data: ' + HISTORICAL_START + '-' + HISTORICAL_END);
print('Projected data: ' + PROJECTED_START + '-' + PROJECTED_END);
附加链接
- USGS LULC 对比 GEE 脚本
- 森林对比 GEE 脚本
许可协议
CC0 1.0 通用(公有领域)。除非另有说明,所有数据、元数据及相关材料均被认为满足其采集目的所需的质量标准。尽管这些数据和相关元数据已经过准确性和完整性审查,并由美国地质调查局(USGS)批准发布,但对该数据在任何其他系统上的显示或用于一般或科学目的的实用性,不作任何明示或暗示的保证,发布行为本身亦不构成任何此类保证。
关键词: 土地覆盖、土地利用、CONUS、IPCC、情景、未来、预测、历史、FORE-SCE、森林林龄、森林干扰、农业普查、生态区
GEE 数据整理: Sayantan Majumdar & Samapriya Roy
GEE 最后更新: 2026-03-24

AtomGit 是由开放原子开源基金会联合 CSDN 等生态伙伴共同推出的新一代开源与人工智能协作平台。平台坚持“开放、中立、公益”的理念,把代码托管、模型共享、数据集托管、智能体开发体验和算力服务整合在一起,为开发者提供从开发、训练到部署的一站式体验。
更多推荐


 10
10 0
0- 0


 已为社区贡献21条内容

所有评论(0)