【0基础学机器学习】2.决策树
决策树模型笔记
1. 基础知识
基本模型形式
决策树是一种常见的监督学习模型,既可以做分类,也可以做回归。它通过一系列“如果…那么…”的规则不断划分特征空间,最终在叶子节点给出预测结果。
对于分类任务,模型会根据样本特征逐层判断,例如:
- 如果花瓣长度小于某个阈值,进入左子树
- 否则进入右子树
最终到达某个叶子节点后,叶子节点中占比最高的类别就是预测类别。
核心目标
决策树的核心目标是:在每一次节点划分时,找到一个最优特征和最优切分点,让划分后的子节点尽可能“纯”。
分类任务中常见目标包括:
- 让同一类别样本尽量落到同一个叶子节点
- 降低节点的不确定性
- 提升整体分类准确率
损失函数
决策树通常不直接写成统一的全局损失函数最小化问题,而是在每个节点上贪心地选择最优划分标准。
常见划分指标有:
- 基尼指数(Gini Index)
- 信息熵(Entropy)
以基尼指数为例:
Gini(D) = 1 - Σ(p_k)^2
其中 p_k 表示样本集合 D 中第 k 类样本所占比例。基尼指数越小,说明节点越纯。
参数求解
决策树的参数求解过程本质上是一个递归划分过程:
- 在当前节点中遍历候选特征
- 为每个特征尝试不同划分阈值
- 计算划分后的不纯度下降
- 选择收益最大的划分方式
- 递归生成左右子树,直到满足停止条件
常见停止条件包括:
- 达到最大树深度
- 节点样本数过少
- 节点已经足够纯
应用示例(Python实现)
本项目使用 scikit-learn 中的 DecisionTreeClassifier 实现一个经典的鸢尾花三分类任务:
from sklearn.tree import DecisionTreeClassifier

model = DecisionTreeClassifier(max_depth=3, random_state=42)
model.fit(x_train, y_train)
y_pred = model.predict(x_test)
注意要点
- 决策树容易过拟合,需要通过
max_depth、min_samples_split等参数控制复杂度 - 决策树对特征缩放不敏感,一般不强制要求标准化
- 树结构可解释性强,适合教学演示和规则分析
- 单棵树性能通常不如集成模型,但更容易理解
2. 代码实践
model.py
model.py 负责定义决策树模型、训练模型和预测接口。这里统一封装了:
build_model():创建模型train_model():拟合训练数据predict():执行预测
from sklearn.tree import DecisionTreeClassifier


def build_model(
    criterion: str = "gini",
    max_depth: int = 3,
    random_state: int = 42,
) -> DecisionTreeClassifier:
    """创建决策树分类模型。"""
    return DecisionTreeClassifier(
        criterion=criterion,
        max_depth=max_depth,
        random_state=random_state,
    )


def train_model(
    x_train,
    y_train,
    criterion: str = "gini",
    max_depth: int = 3,
    random_state: int = 42,
) -> DecisionTreeClassifier:
    """训练决策树分类模型。"""
    model = build_model(
        criterion=criterion,
        max_depth=max_depth,
        random_state=random_state,
    )
    model.fit(x_train, y_train)
    return model


def predict(model: DecisionTreeClassifier, x_test):
    """使用训练好的模型进行预测。"""
    return model.predict(x_test)
train.py
train.py 负责训练流程,包括:
- 训练集和测试集划分
- 调用
train_model()完成训练
代码中使用了 stratify=y,保证分类任务中训练集和测试集的类别分布更加稳定。
from sklearn.model_selection import train_test_split

from model import train_model


def split_data(
    x,
    y,
    test_size: float = 0.2,
    random_state: int = 42,
):
    """划分训练集和测试集。"""
    return train_test_split(
        x,
        y,
        test_size=test_size,
        random_state=random_state,
        stratify=y,
    )


def run_train(
    x,
    y,
    test_size: float = 0.2,
    random_state: int = 42,
    criterion: str = "gini",
    max_depth: int = 3,
):
    """完成数据划分和模型训练。"""
    x_train, x_test, y_train, y_test = split_data(
        x,
        y,
        test_size=test_size,
        random_state=random_state,
    )
    model = train_model(
        x_train,
        y_train,
        criterion=criterion,
        max_depth=max_depth,
        random_state=random_state,
    )
    return model, x_train, x_test, y_train, y_test
eval.py
eval.py 负责评估模型效果,输出:
- 准确率
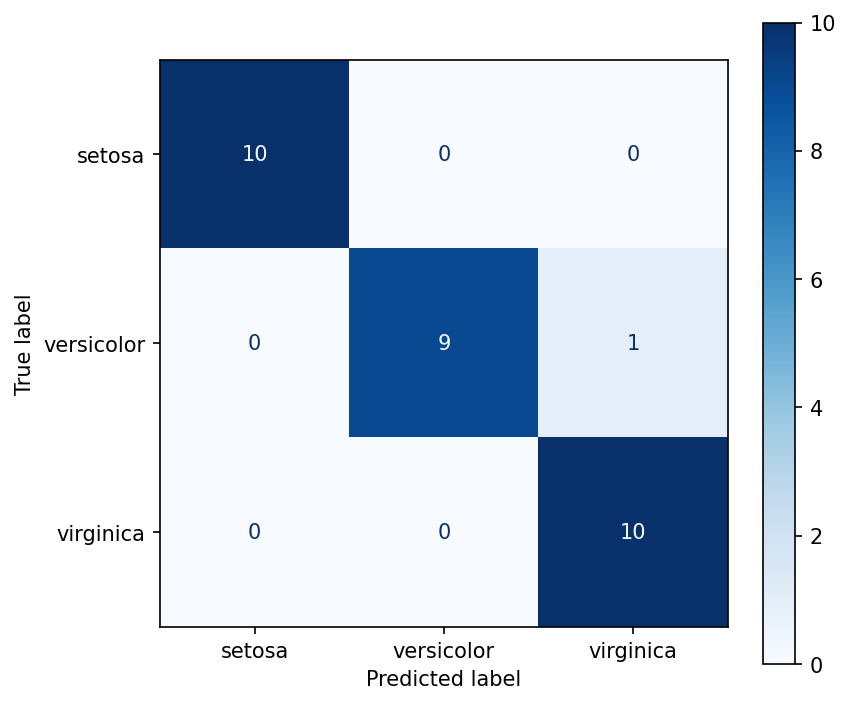
accuracy - 混淆矩阵
confusion_matrix - 分类报告
classification_report
这些指标能帮助我们同时观察总体表现和各类别的精确率、召回率、F1 值。
from sklearn.metrics import accuracy_score, classification_report, confusion_matrix

from model import predict


def evaluate_model(model, x_test, y_test) -> dict:
    """评估决策树分类模型效果。"""
    y_pred = predict(model, x_test)
    return {
        "accuracy": accuracy_score(y_test, y_pred),
        "confusion_matrix": confusion_matrix(y_test, y_pred),
        "classification_report": classification_report(y_test, y_pred),
    }
dataload.py
dataload.py 从 sklearn.datasets 中加载鸢尾花数据集:
- 特征
x:4 个花萼/花瓣数值特征 - 标签
y:3 个类别标签 target_names:类别名称,用于可视化展示
import pandas as pd
from sklearn.datasets import load_iris


def load_data():
    """加载 sklearn 自带的 iris 分类数据集。"""
    dataset = load_iris()
    x = pd.DataFrame(dataset.data, columns=dataset.feature_names)
    y = pd.Series(dataset.target, name="target")
    return x, y, dataset.target_names
run.py
run.py 是项目入口,负责串联整个流程:
- 加载数据
- 训练模型
- 评估模型
- 保存可视化结果
可视化部分包含:
- 决策树结构图
- 混淆矩阵图
from pathlib import Path

import matplotlib

matplotlib.use("Agg")

import matplotlib.pyplot as plt
from sklearn.metrics import ConfusionMatrixDisplay
from sklearn.tree import plot_tree

from dataload import load_data
from eval import evaluate_model
from model import predict
from train import run_train


def save_plots(model, x_test, y_test, class_names) -> list[Path]:
    """保存决策树结构图和混淆矩阵图。"""
    current_dir = Path(__file__).resolve().parent
    output_dir = current_dir / "figure"
    output_dir.mkdir(exist_ok=True)

    tree_path = output_dir / "decision_tree_structure.png"
    cm_path = output_dir / "decision_tree_confusion_matrix.png"

    fig, ax = plt.subplots(figsize=(16, 10))
    plot_tree(
        model,
        feature_names=list(x_test.columns),
        class_names=list(class_names),
        filled=True,
        rounded=True,
        ax=ax,
    )
    fig.tight_layout()
    fig.savefig(tree_path, dpi=150, bbox_inches="tight")
    plt.close(fig)

    fig, ax = plt.subplots(figsize=(6, 5))
    ConfusionMatrixDisplay.from_predictions(
        y_test,
        predict(model, x_test),
        display_labels=class_names,
        cmap="Blues",
        ax=ax,
    )
    fig.tight_layout()
    fig.savefig(cm_path, dpi=150, bbox_inches="tight")
    plt.close(fig)

    return [tree_path, cm_path]


def main() -> None:
    x, y, class_names = load_data()
    model, x_train, x_test, y_train, y_test = run_train(x, y)
    metrics = evaluate_model(model, x_test, y_test)
    plot_paths = save_plots(model, x_test, y_test, class_names)

    print("Decision Tree Demo")
    print(f"Train size: {len(x_train)}, Test size: {len(x_test)}")
    print(f"Accuracy: {metrics['accuracy']:.4f}")
    print("Confusion Matrix:")
    print(metrics["confusion_matrix"])
    print("Classification Report:")
    print(metrics["classification_report"])
    print("Saved plots:")
    for plot_path in plot_paths:
        print(plot_path)


if __name__ == "__main__":
    main()
运行结果
运行 python run.py 后,终端会输出训练集/测试集大小、准确率、混淆矩阵和分类报告。
图片会保存在当前目录下的 figure/ 文件夹中,通常包括:
decision_tree_structure.pngdecision_tree_confusion_matrix.png
如果分类结果接近满分,这是因为鸢尾花数据集本身比较经典且较容易划分,适合作为决策树入门 demo。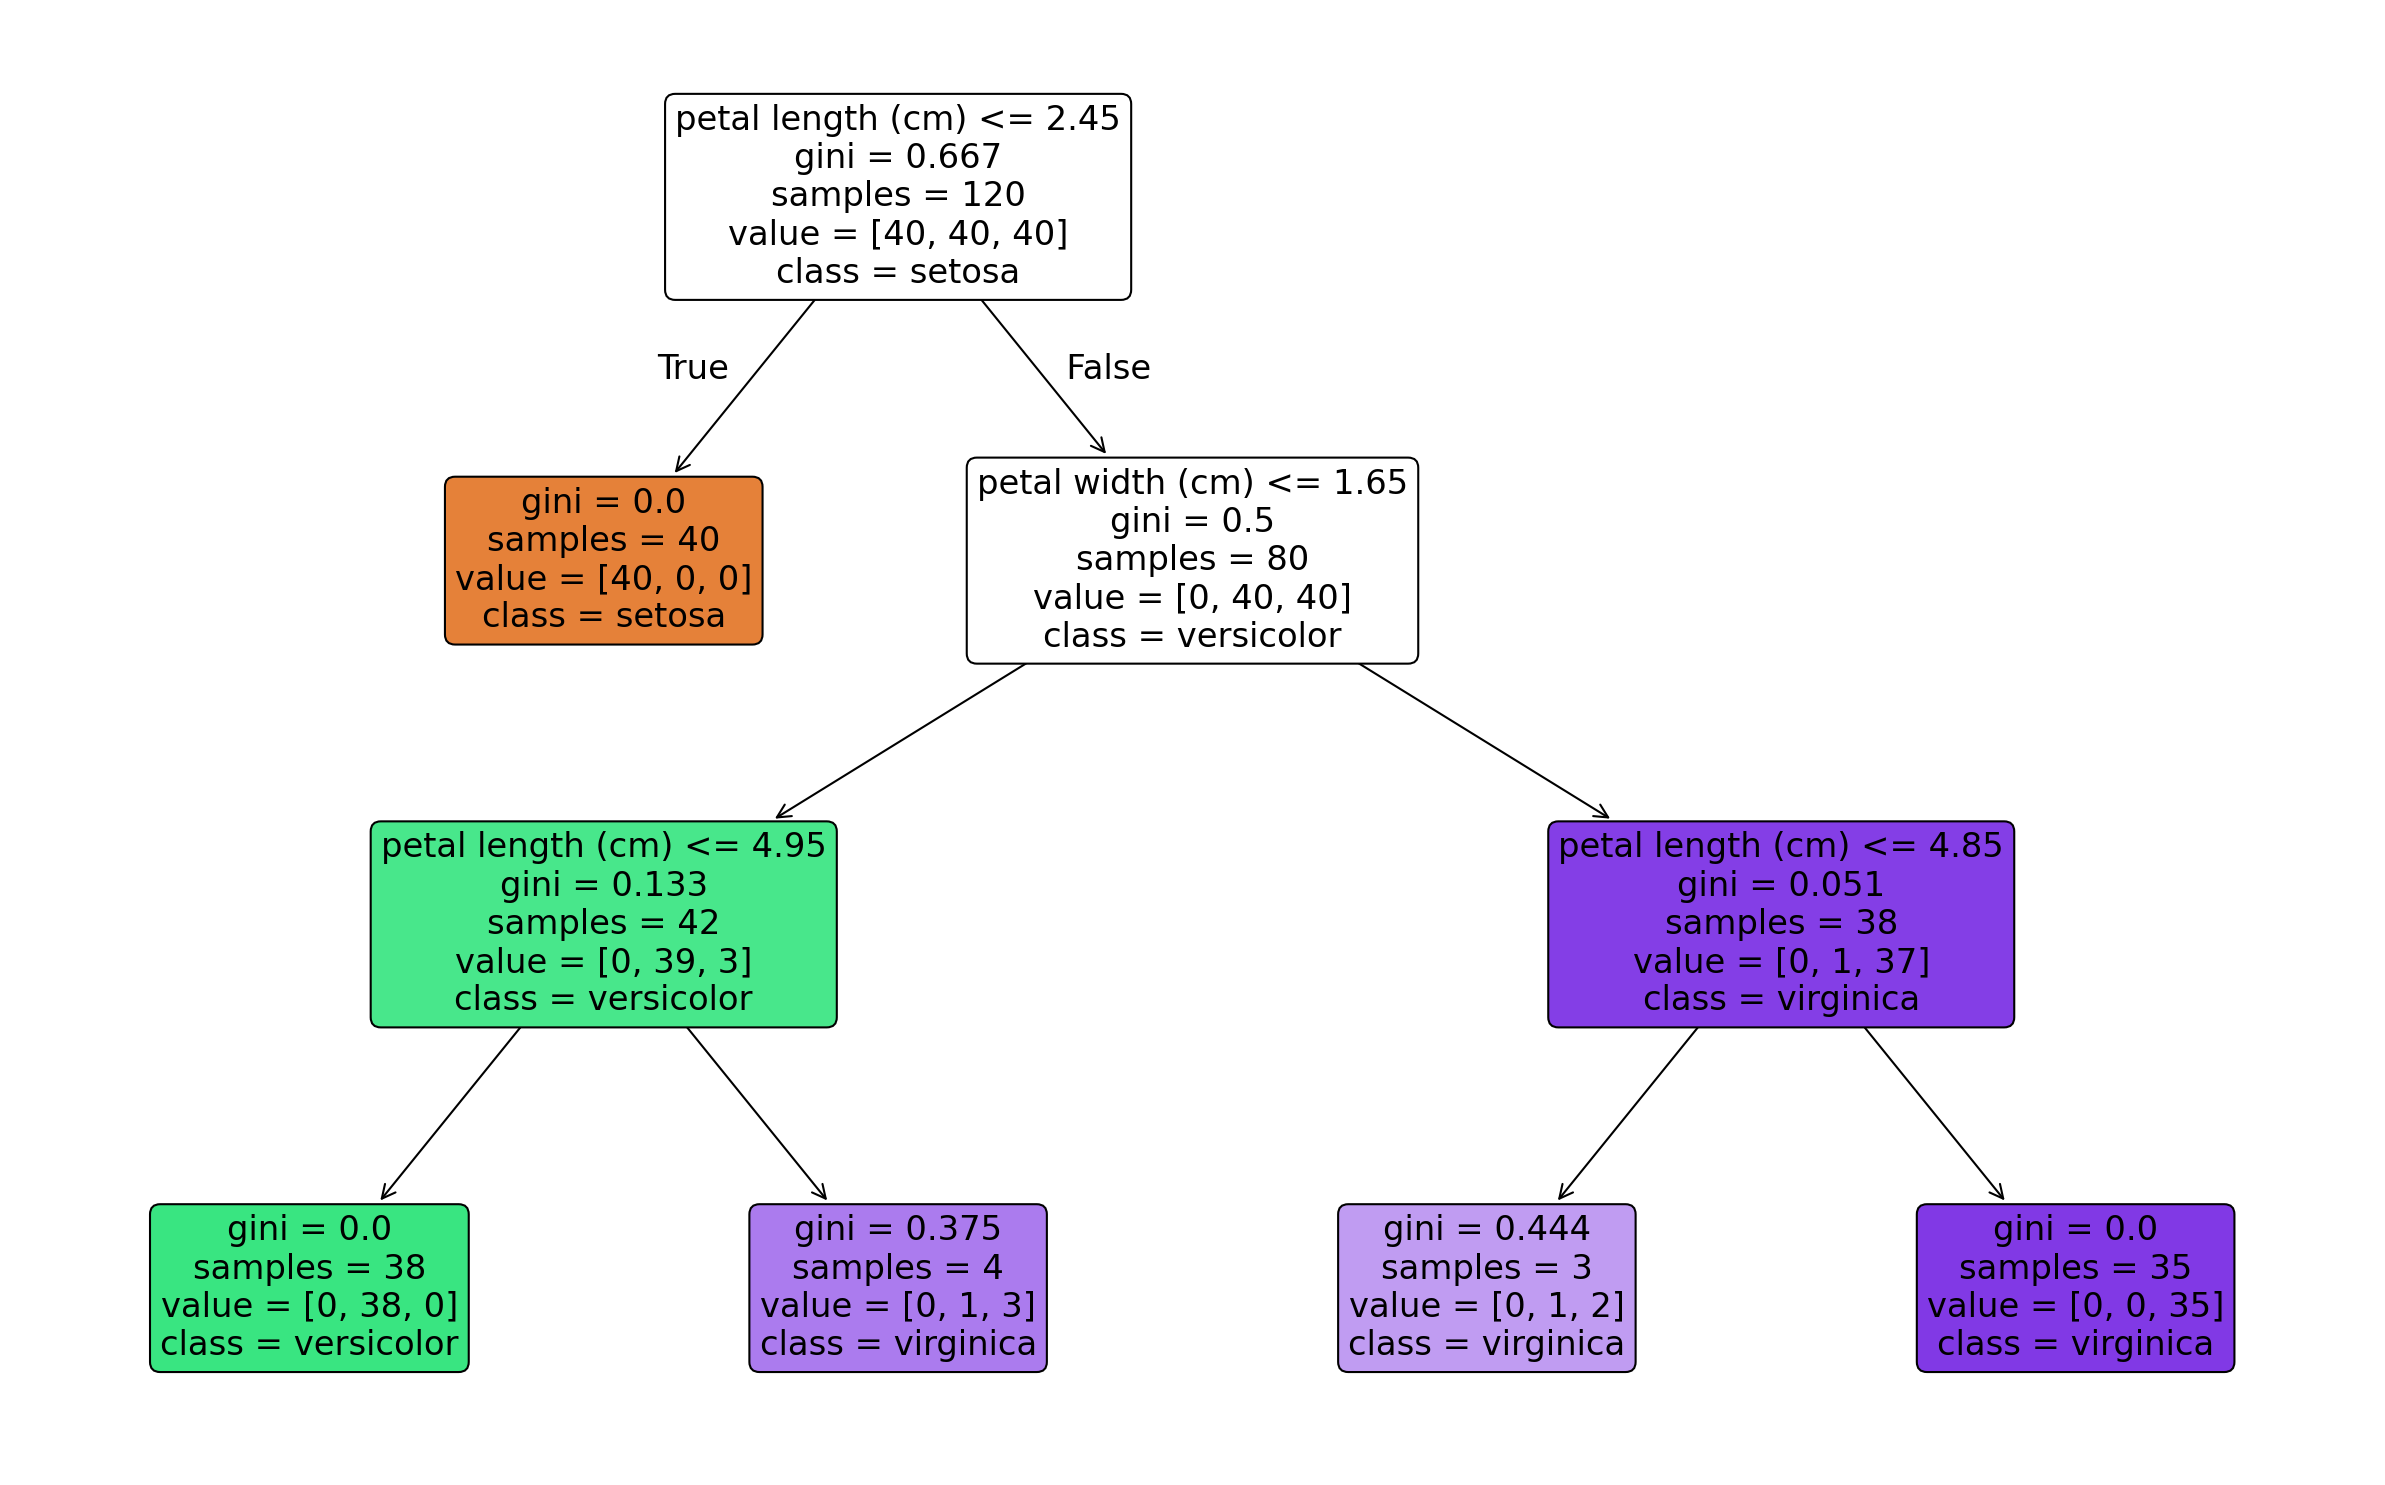

AtomGit 是由开放原子开源基金会联合 CSDN 等生态伙伴共同推出的新一代开源与人工智能协作平台。平台坚持“开放、中立、公益”的理念,把代码托管、模型共享、数据集托管、智能体开发体验和算力服务整合在一起,为开发者提供从开发、训练到部署的一站式体验。
更多推荐

 6
6 0
0- 0


 已为社区贡献2条内容

所有评论(0)