基于Python对淘宝用户行为数据集的个人分析
前言
本项目采用 AARRR、RFM 模型完成用户行为深度分析,并基于头部销售商品与品类的交叉维度,构建商品分析体系。
样本量确定部分借鉴了阿里天池平台的用户uqu7n4ytlopk6的内容,其文章链接将附在参考文献中。
由于数据中无自传播和用户消费金额两项数据,故AARRR模型中关于Referral(自传播)的分析被舍去,RFM模型中关于Monetary(消费金额)的分析被舍去。
所有关于数据处理的说明与逻辑,均已内嵌至代码注释中。
一、分析目标
通过深度挖掘并可视化用户行为数据,为平台用户及商品运营提供数据支撑与决策依据,助力优化运营资源配置、提升整体业务收入。
二、数据来源与理解
1. 数据来源
阿里天池:https://tianchi.aliyun.com/dataset/649
2. 数据理解
数据集包含了2017年11月25日至2017年12月3日之间,有行为的约一百万随机用户的所有行为(行为包括点击、购买、加购、喜欢)。数据集的组织形式和MovieLens-20M类似,即数据集的每一行表示一条用户行为,由用户ID、商品ID、商品类目ID、行为类型和时间戳组成,并以逗号分隔。
| 列名称 | 说明 | 数据量 |
|---|---|---|
| 用户ID | 整数类型,序列化后的用户ID | 987,994 |
| 商品ID | 整数类型,序列化后的商品ID | 4,162,024 |
| 商品类目ID | 整数类型,序列化后的商品所属类目ID | 987,994 |
| 行为类型 | 字符串,枚举类型,包括(‘pv’(点击), ‘buy’(购买), ‘cart’(加购), ‘fav’(收藏)) | 9,439 |
| 时间戳 | 行为发生的时间戳 | 100,150,807 |
三、数据处理
1. 随机抽样
1.1 样本量确定
因1亿条数据量过大,为加快程序运行速度,本研究采用随机抽样法分析全体用户行为。以987994个用户的行为为总体,设定95%置信水平、1%误差范围,且假定潜在购买倾向用户行为占比50%,通过Cochran公式计算初始样本量,并经有限总体修正后,最终确定9512个用户的行为记录为研究样本(Cochran 公式:Z2p(1-p)/E2;有限总体修正公式:n0/(1+(n0-1)/n))。
1.2 数据抽样
import pandas as pd

start_time = time.time()
column_names = ['user_id', 'item_id', 'category_id', 'behavior_type', 'timestamp']
chunks = []

# 分块读取数据,每次读取100万行
for chunk in pd.read_csv("dataset/UserBehavior.csv",
                         chunksize=1_000_000,
                         names=column_names,
                         dtype={"user_id": "int32", "item_id": "int32", "category_id": "int32"},
                         header=None):
    chunks.append(chunk)

# 合并所有分块
df = pd.concat(chunks, ignore_index=True)

# 不重复抽取样本
n = 9512
unique_sample_ids = df['user_id'].drop_duplicates().sample(n=n, random_state=42).reset_index(drop=True)

filtered_df = df[df['user_id'].isin(unique_sample_ids)].copy()

# 将抽样出的数据保存为新文件
filtered_df.to_csv("dataset/sample_userbehavior.csv", index=False, encoding='utf-8-sig')
2. 数据清洗
import pandas as pd
import numpy as np
import matplotlib.pyplot as plt
import seaborn as sns
import plotly.graph_objects as go
import plotly.express as px
import time, datetime
from tabulate import tabulate

# 设置中文字体
plt.rcParams['font.sans-serif'] = ['SimHei']
plt.rcParams['axes.unicode_minus'] = False

# 读取抽样后的数据
df = pd.read_csv("dataset\sample_userbehavior.csv")

# 检查空值
df.isnull().sum()

# 转换数据类型
df['time_stamp'] = pd.to_datetime(df['timestamp'], unit='s')+datetime.timedelta(hours=8)

# 提取日期、时间数据
df['date'] = df['time_stamp'].dt.date
df['hour'] = df['time_stamp'].dt.hour

# 剔除11.25-12.03以外的数据
df['date'] = pd.to_datetime(df['date'], format='%Y-%m-%d')
df = df[df['date'].between('2017-11-25', '2017-12-03')]

# 删除不需要的列
df = df.drop(['timestamp', 'time_stamp'], axis=1)

# 预览前5行数据
df.head()

df.info()
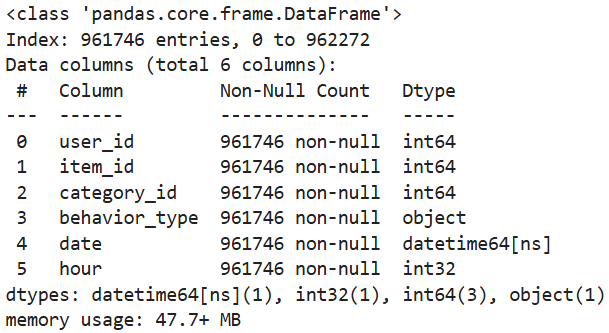
统计得到各列无空值,剔除用于分析的时间范围外的数据,最终用于分析的数据共962272条。
四、数据分析
1. 用户行为概览
1.1 基于按天的用户行为分析
# 按天统计用户各行为数量
daily_analysis = df.groupby(['date', 'behavior_type'])['user_id'].count().reset_index()
daily_analysis.columns = ['date', 'behavior_type', 'count']

# 数据可视化
fig, ax = plt.subplots(2, 1, figsize=(10, 8))

sns.lineplot(daily_analysis,
             x='date',
             y='count',
             hue='behavior_type',
             marker='o',
             ax=ax[0])
ax[0].set_title('用户行为类型——按天')
ax[0].set_xlabel('日期')
ax[0].set_ylabel('行为类型')
ax[0].grid(
        axis='y',
        linestyle='--',
        alpha=0.7,
        color='lightgray')

# 将除pv以外的数据单独绘制
daily_analysis_no_pv = daily_analysis[daily_analysis['behavior_type'] != 'pv']
sns.lineplot(daily_analysis_no_pv,
             x='date',
             y='count',
             hue='behavior_type',
             marker='o',
             ax=ax[1])
ax[1].set_title('用户行为类型(buy、cart、fav)——按天')
ax[1].set_xlabel('日期')
ax[1].set_ylabel('行为类型')
ax[1].grid(
        axis='y',
        linestyle='--',
        alpha=0.7,
        color='lightgray')

plt.tight_layout()
plt.savefig('day_behavior.png', dpi=300, bbox_inches='tight')
plt.show()
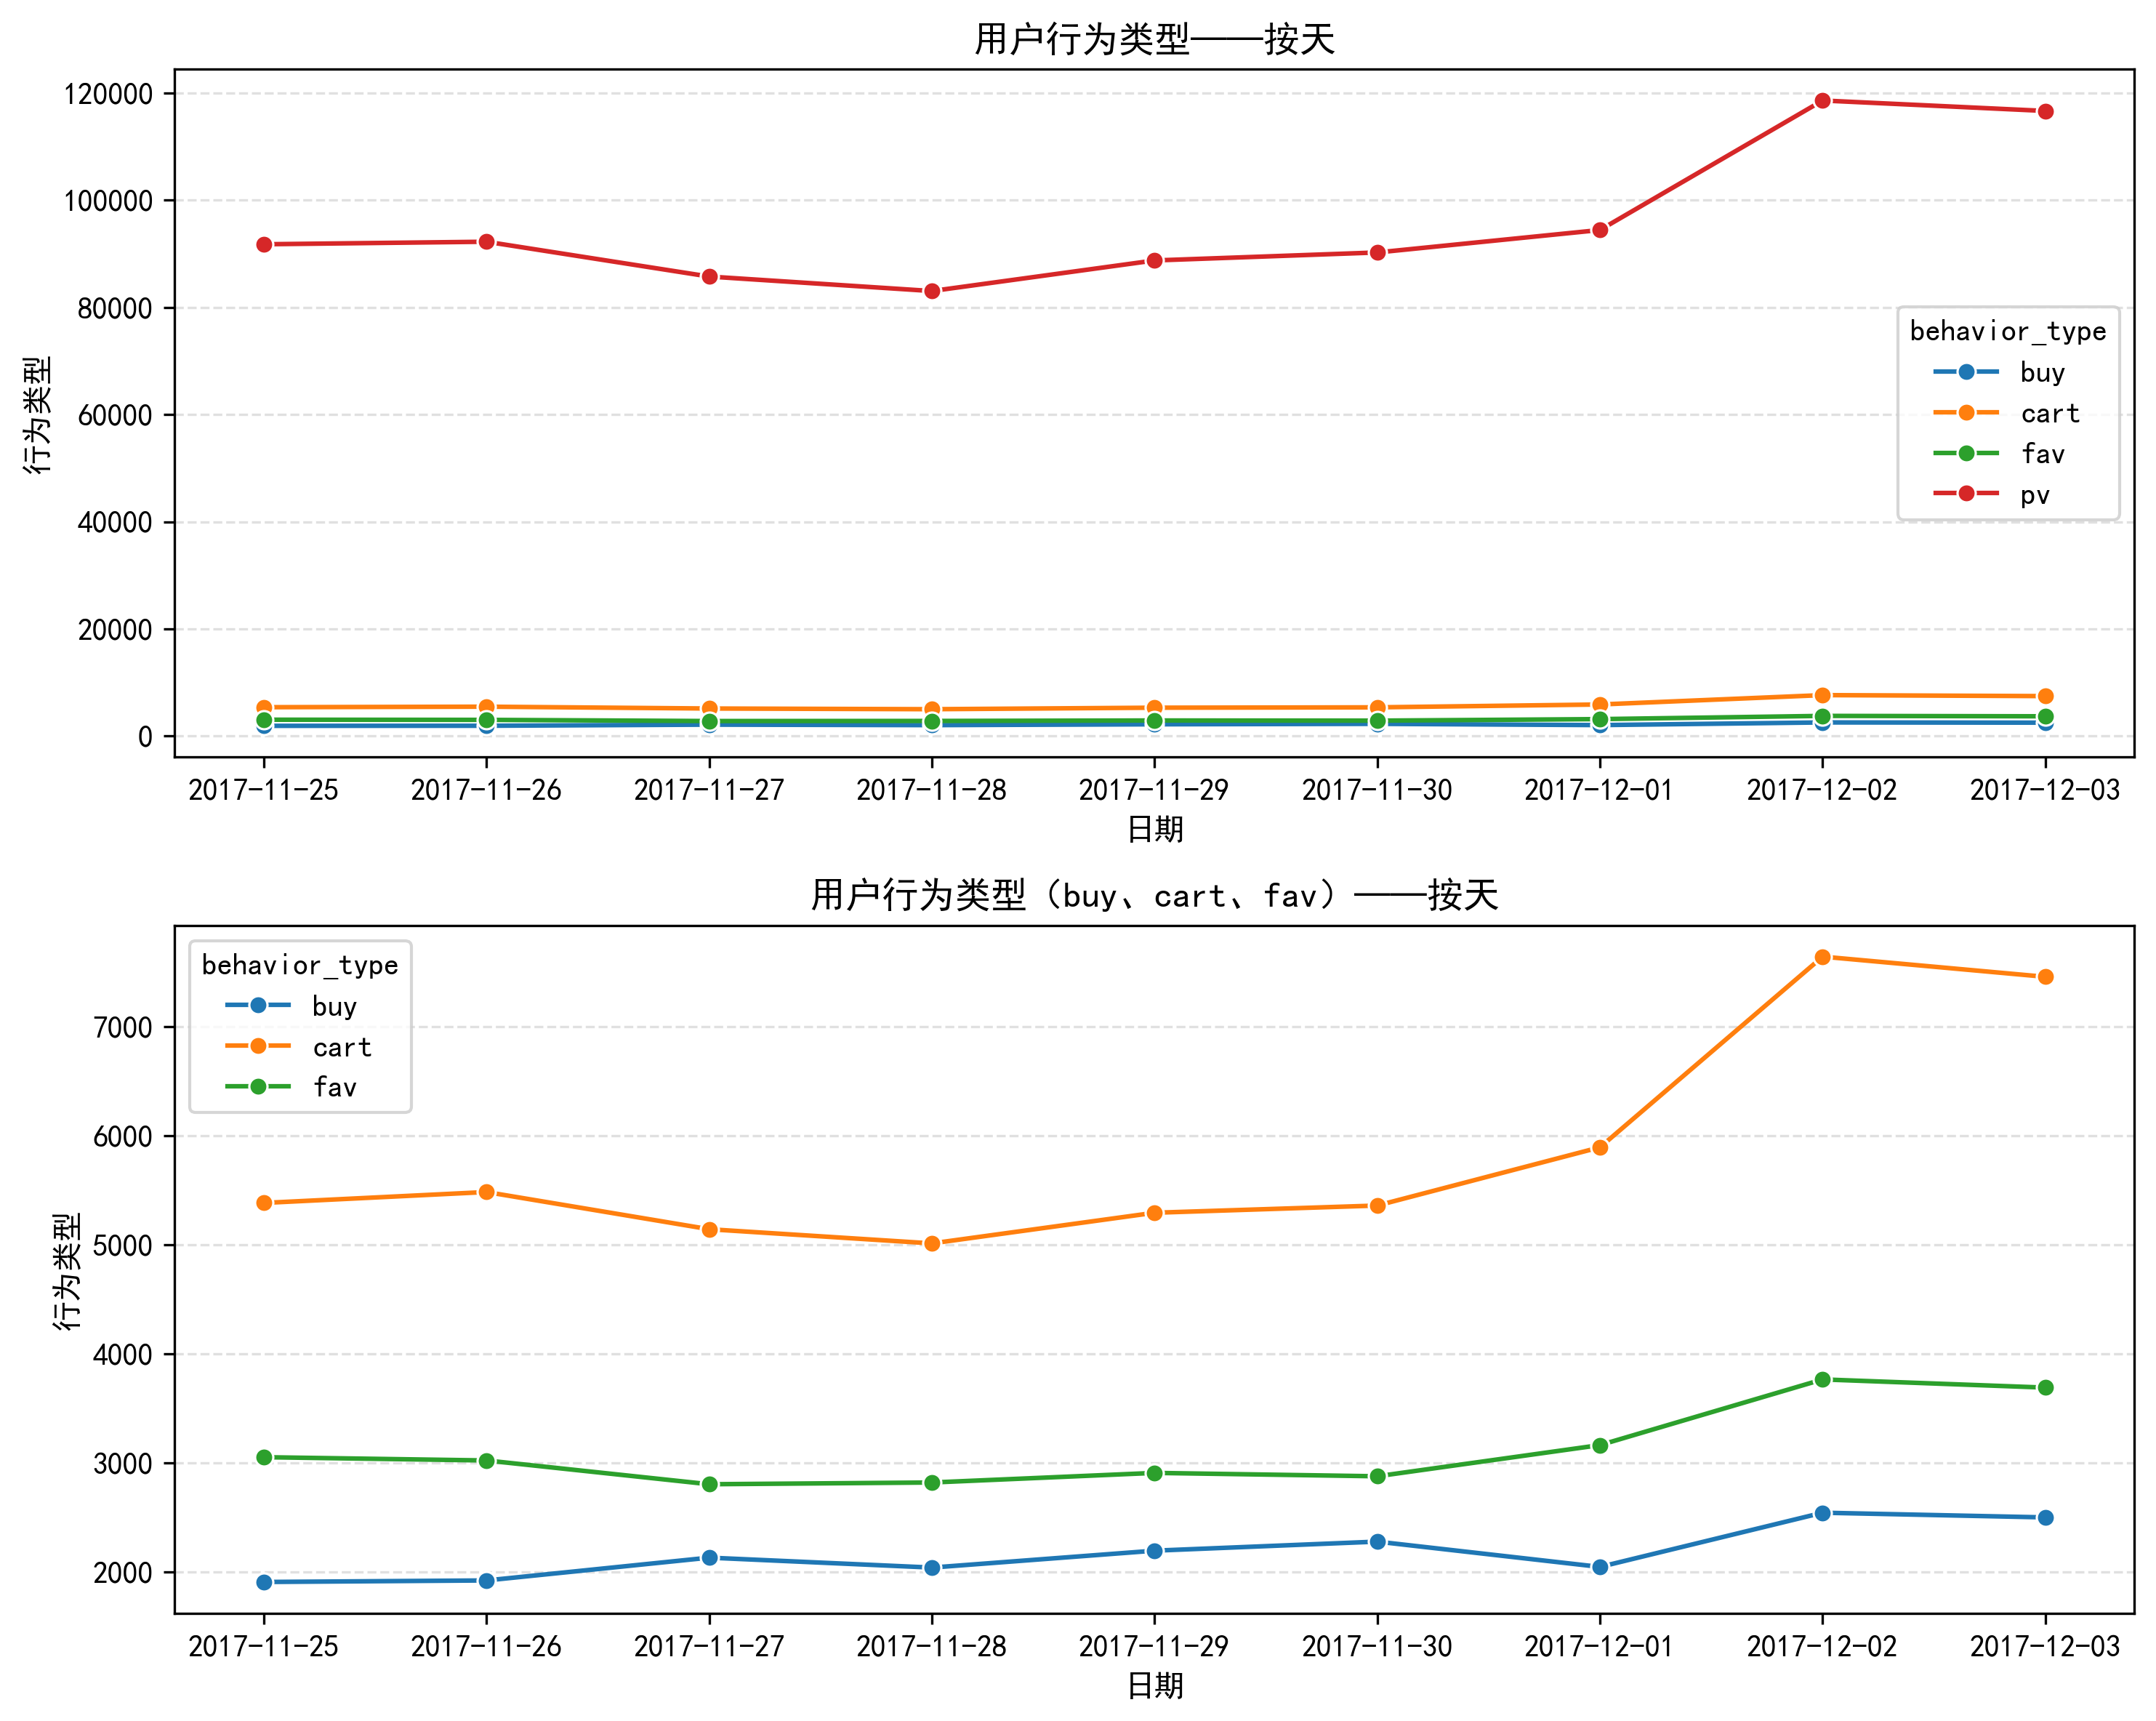
从图表中可以明显观察到,12月2日与12月3日的各类用户行为数据较此前日期出现大幅增长。
分析:本次数据集共覆盖9天行为记录,时间跨度为一周,因此首先判断增长是否与周末效应相关。对照日历可知,11月25—26日、12月2—3日均为周末,但12月这两天的行为量显著高于上一个周末及周内水平,增长幅度异常突出,由此推测平台在此期间推出了相关促销活动。
结合公开信息进一步验证,淘宝于12月1日正式启动双十二预热活动。由于12月1日为周五工作日,行为增幅相对有限;而进入周末后,用户活跃度集中释放,最终形成12月2—3日行为数据的大幅攀升。
1.2 基于按小时的用户行为分析
daily_analysis = df.groupby(['hour', 'behavior_type'])['user_id'].count().reset_index()
daily_analysis.columns = ['hour', 'behavior_type', 'count']
all_xticks = df['hour'].unique()

fig, ax = plt.subplots(2, 1, figsize=(10, 8))

sns.lineplot(daily_analysis,
             x='hour',
             y='count',
             hue='behavior_type',
             marker='o',
             ax=ax[0])
ax[0].set_title('用户行为类型——按小时')
ax[0].set_xlabel('时间')
ax[0].set_ylabel('行为类型')
ax[0].grid(
        axis='y',
        linestyle='--',
        alpha=0.7,
        color='lightgray')
ax[0].set_xticks(all_xticks)

# 将除pv以外的数据单独绘制
daily_analysis_no_pv = daily_analysis[daily_analysis['behavior_type'] != 'pv']
sns.lineplot(daily_analysis_no_pv,
             x='hour',
             y='count',
             hue='behavior_type',
             marker='o',
             ax=ax[1])
ax[1].set_title('用户行为类型(buy、cart、fav)——按小时')
ax[1].set_xlabel('时间')
ax[1].set_ylabel('行为类型')
ax[1].grid(
        axis='y',
        linestyle='--',
        alpha=0.7,
        color='lightgray')
ax[1].set_xticks(all_xticks)

plt.tight_layout()
plt.savefig('hour_behavior.png', dpi=300, bbox_inches='tight')
plt.show()
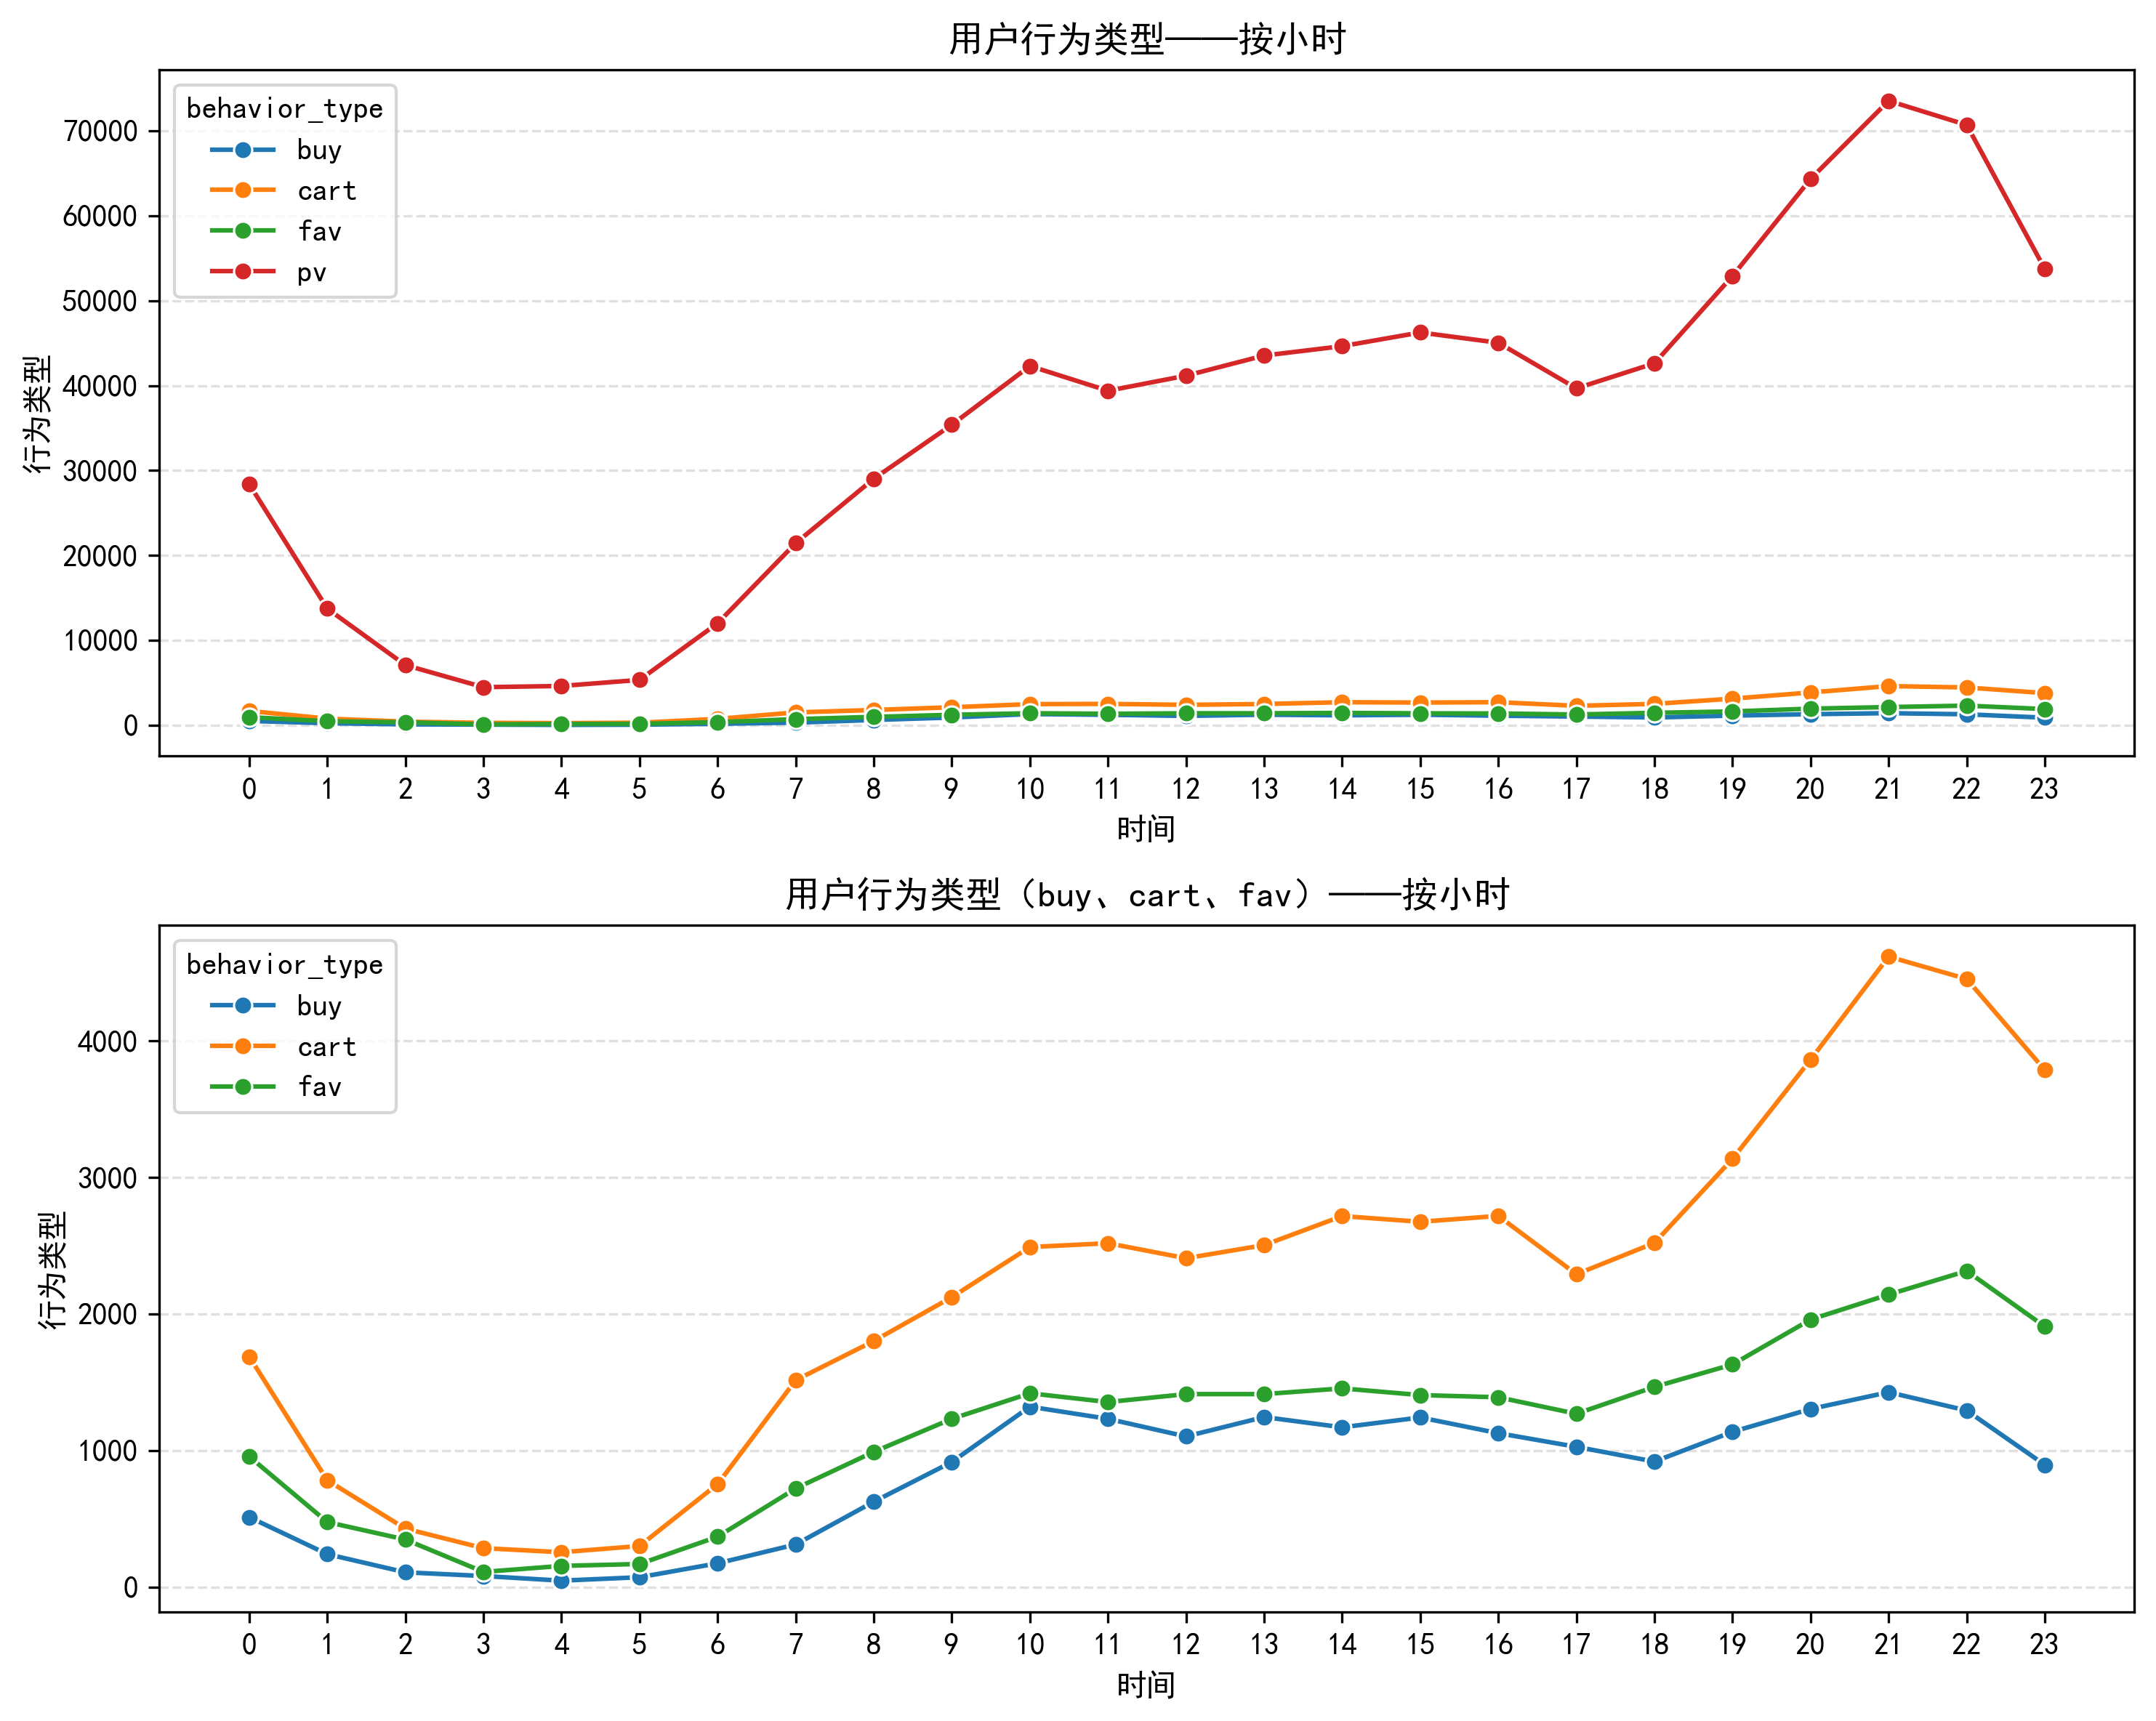
用户行为数量从凌晨5点起逐步攀升,并于10点达到日间高位;10点至16点期间整体保持小幅震荡,16点至18点出现短暂回落;18点至21点行为量再次大幅上升,形成全天峰值;21点后至次日凌晨5点,行为数量显著下降并持续处于低位。
分析:用户整体行为节律与日常作息高度吻合。晚间18点至21点的显著高峰,契合都市人群下班后的休闲购物时段,反映出用户在通勤、休息及闲暇时段的行为特征。
1.3 小结
①平台在活动期间,于周末的推广效果更为显著,用户行为增幅突出。
②用户流量在早晚高峰时段(18:00–21:00)增长明显,且购买转化率呈持续上升趋势。
2. AARRR模型分析
2.1 Acquisition:用户获取
# 总UV:即抽样用户数9512
uv = df['user_id'].nunique()

# 日新增用户数
min_load_day = df.groupby('user_id')['date'].min().reset_index()
daily_new_user = min_load_day.groupby('date')['user_id'].count().reset_index(name='count')

# 可视化日访问人数、每日新增访问人数
fig, ax = plt.subplots(2, 1, figsize=(9, 8))

ax[0].plot(daily_uv['date'], daily_uv['count'], marker='o')
ax[0].set_ylim(bottom=4000)
ax[0].set_title('每日访客数')
ax[0].grid(axis='y', linestyle='--', alpha=0.7)

ax[1].plot(daily_new_user['date'], daily_new_user['count'], marker='o')
ax[1].set_ylim(bottom=0)
ax[1].set_title('日新增用户数')
ax[1].grid(axis='y', linestyle='--', alpha=0.7)

for x, y in zip(daily_uv['date'], daily_uv['count']):
    ax[0].text(x, y+1, f'{y}', ha='center', va='bottom', fontsize=9)
for x, y in zip(daily_new_user['date'], daily_new_user['count']):
    ax[1].text(x, y+1, f'{y}', ha='center', va='bottom', fontsize=9)

plt.tight_layout()
plt.savefig('uv_day.png', dpi=300, bbox_inches='tight')
plt.show()
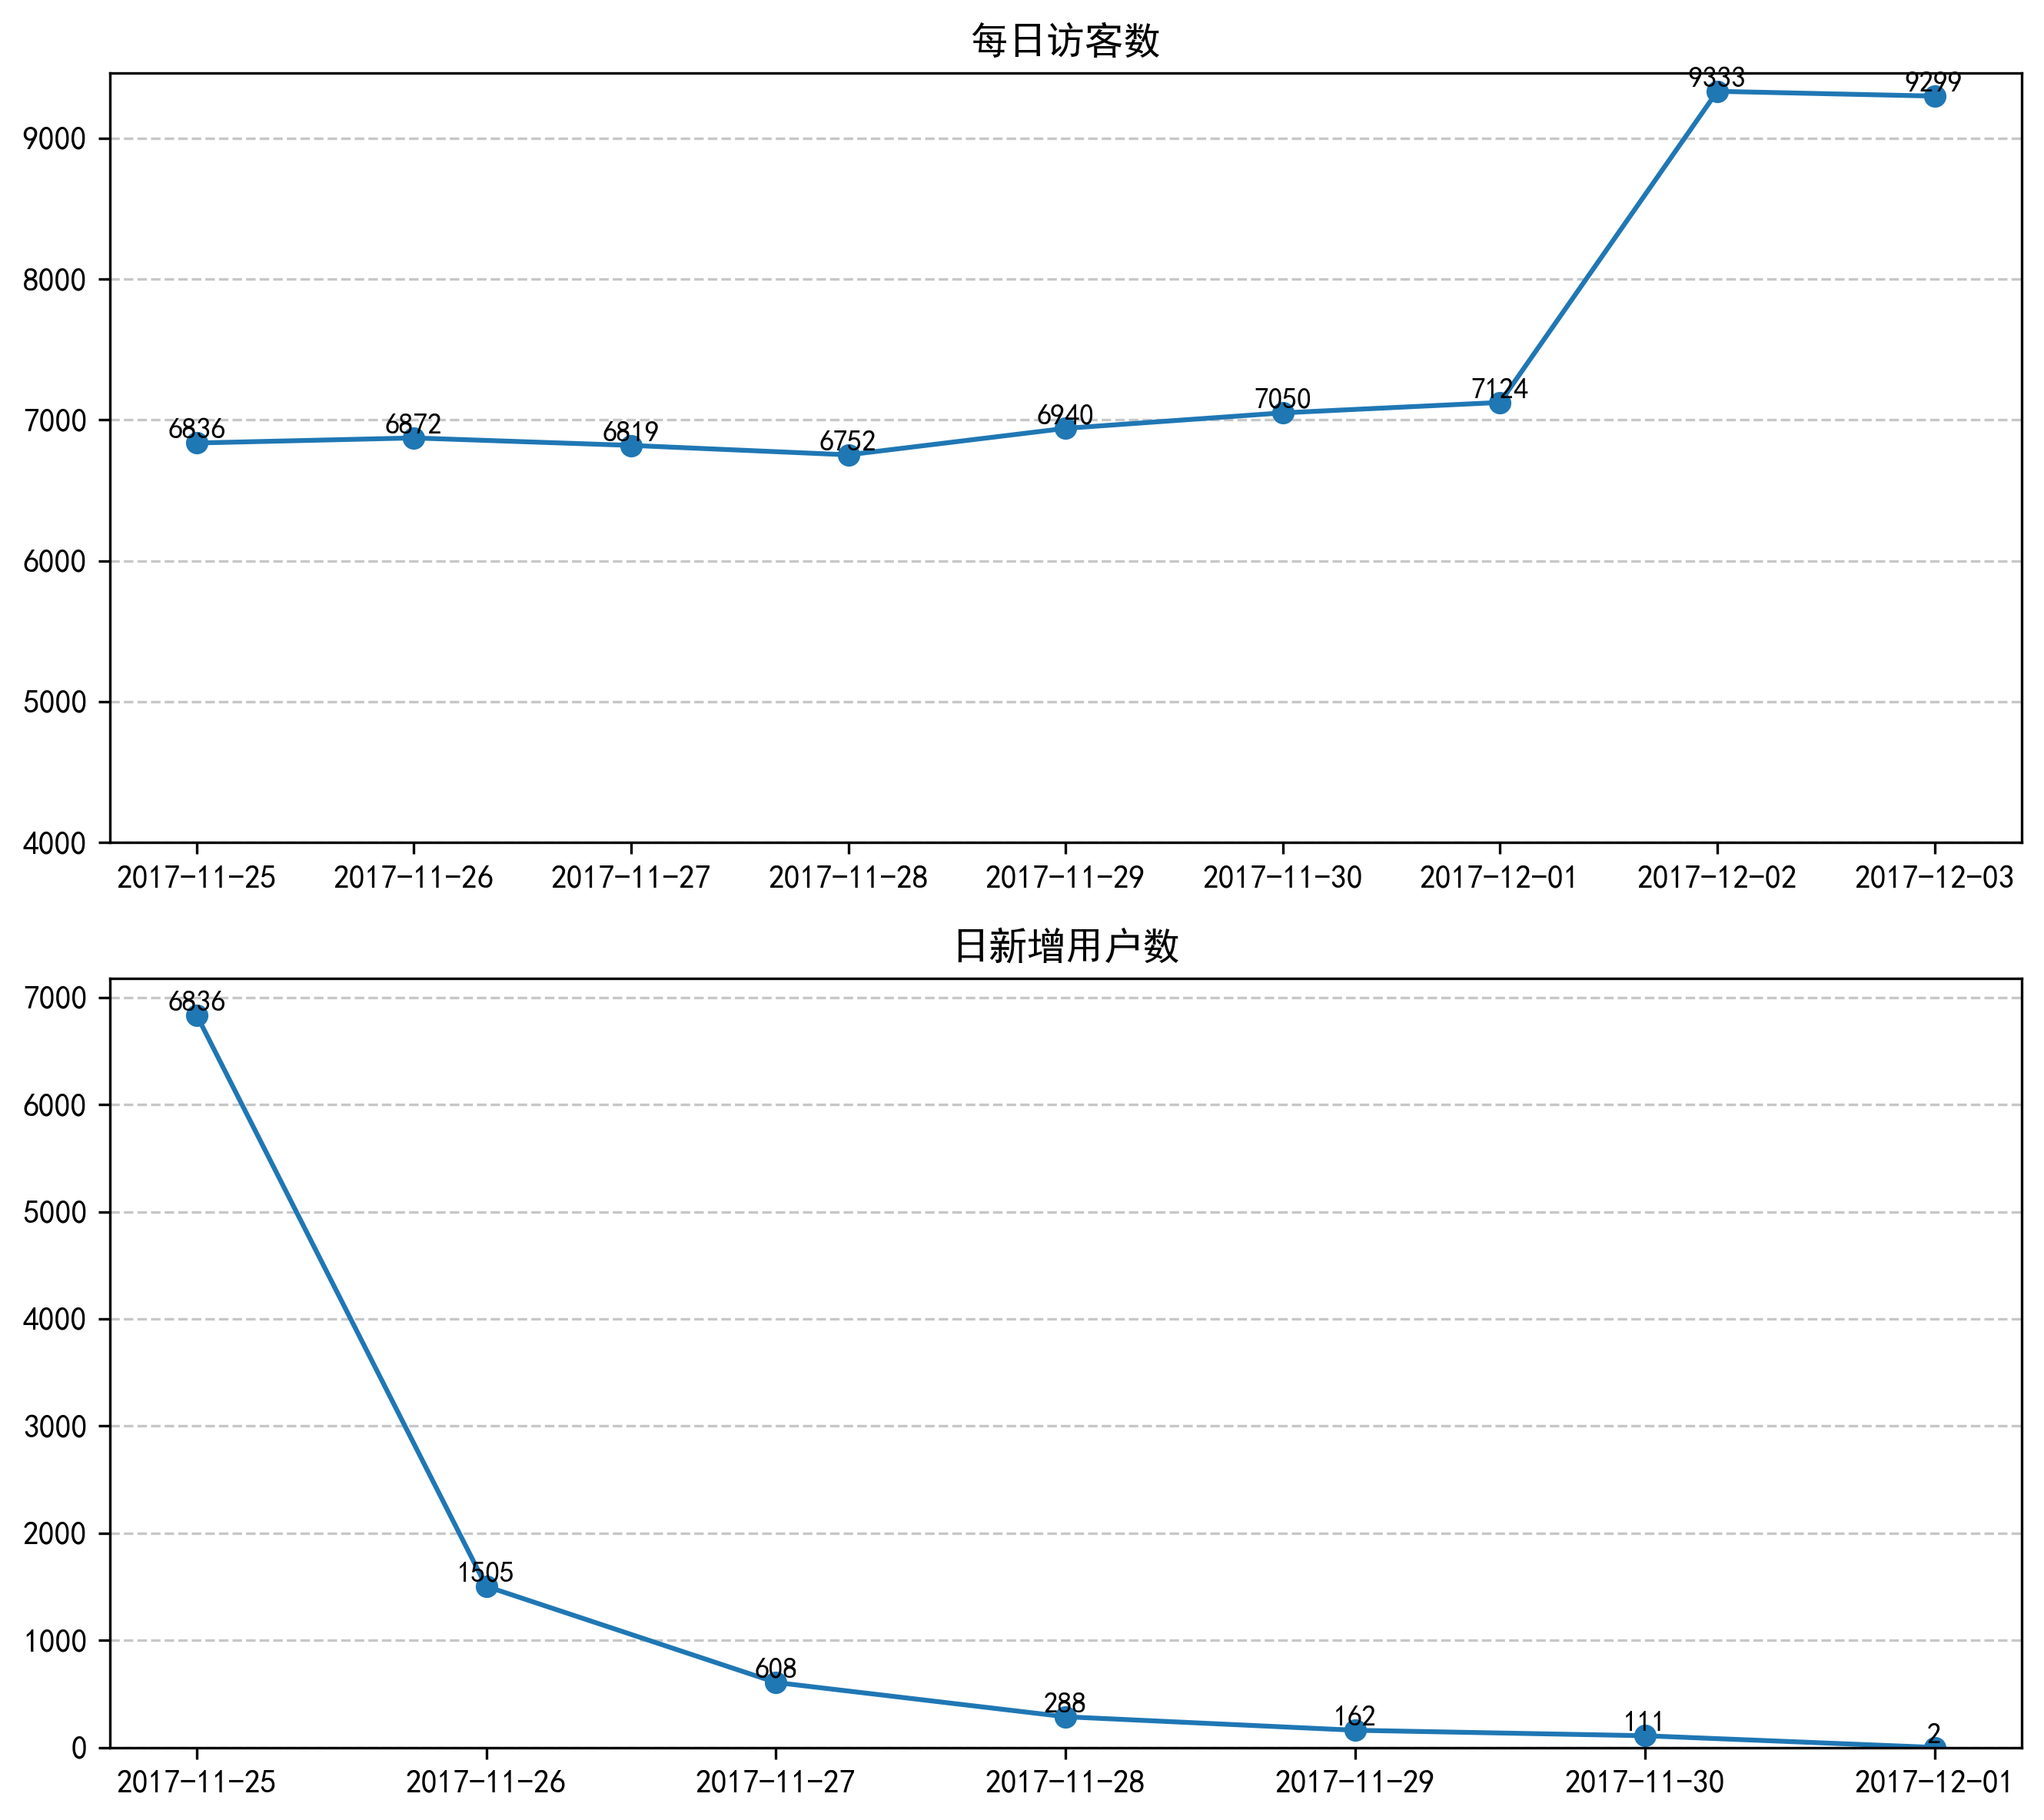
由图可见,日新增用户数量整体呈下降趋势,11月25日—12月1日期间每日访客数波动较小,新增用户与流失用户规模基本持平。
而12月2日、3日两天的访客数分别占总访客数的98%和97.76%,表明淘宝在该周末节点推出的预热活动有效拉动了用户回流,拉新召回效果显著。
2.2 Activation:用户激活
# 平均访问深度
pv = df[df['behavior_type']=='pv'].shape[0]
avg_depth = pv / uv

# 页面跳失率
user_action_count = df.groupby('user_id')['behavior_type'].count().reset_index()
user_action_once = user_action_count[user_action_count['behavior_type']==1].shape[0]
bounce_rate = user_action_once / uv

# 激活用户数(cart、fav、buy任意一种即可)、激活率
action = ['cart', 'fav', 'buy']
active_users = df[df['behavior_type'].isin(action)]['user_id'].nunique()
active_users_ratio = active_users / uv * 100

# 加购率
cart = df[df['behavior_type']=='cart']['user_id'].nunique()
cart_ratio = cart / uv * 100

# 收藏率
fav = df[df['behavior_type']=='fav']['user_id'].nunique()
fav_ratio = cart / uv * 100

print(f"""
平均访问深度:{avg_depth:.2f}

跳失率:{bounce_rate:.2%}

激活用户数: {active_users:.0f}

激活率: {active_users_ratio:.2f}%
""")
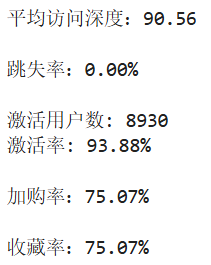
从图表中可见,前四项指标与行业常规参考值相比均处于优秀水平,但数据表现过于理想化,存在明显异常。
因此,本文剔除12月1日—3日活动期间的数据后重新测算,结果如下(因计算逻辑与前文高度一致,代码不再重复展示):
from tabulate import tabulate

metric = pd.DataFrame({
    '包含预热活动': [avg_depth, bounce_rate, active_users, active_users_ratio, cart_ratio, fav_ratio],
    '不包含预热活动': [avg_depth_11, bounce_rate_11, active_users_11, active_users_ratio_11, cart_ratio_11, fav_ratio_11]
    }, index=['平均访问深度', '跳失率', '激活用户数', '激活率', '加购率', '收藏率'])
metric['下降数值'] = (metric['不包含预热活动'] - metric['包含预热活动'])
print(tabulate(
    round(metric.reset_index(names='指标'), 2),
    headers='keys',
    tablefmt='grid',
    stralign='center',
    showindex=False)
)
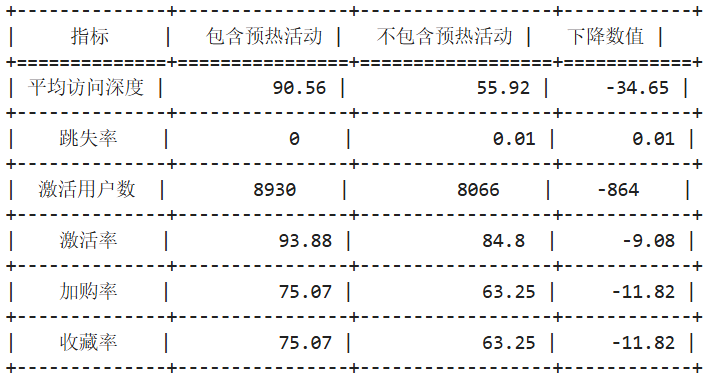
分析:剔除双十二预热活动期间的数据后可见,各项用户行为指标均出现不同程度回落,同时跳失率有所上升,说明活动效应对整体用户行为数据影响显著。
在非活动时段,平台核心指标仍表现良好,反映出用户粘性较高,业务仍具备较高的转化潜力。
2.3 Retention:用户留存
# 留存率
def retention_rate(data_frame, load_date):
    first_load_date, retention_dates = load_date
    base_new_users = data_frame[data_frame['date']==first_load_date][['user_id']]
    base_count = base_new_users['user_id'].nunique()
    print(f"留存率:\n基准日期:{first_load_date:<12}新增用户数:{base_count}")
    print("-" * 40)

    for rdl in retention_dates:
        load_users = data_frame[data_frame['date']==rdl][['user_id']]
        retention_users = pd.merge(load_users, base_new_users, how='inner', on='user_id')
        retention_users_count = retention_users['user_id'].nunique()
        retention_ratio = retention_users_count / base_count
        print(f"-{rdl}留存用户数:{retention_users_count:<6}留存率:{retention_ratio:.2%}")

load_date = ('2017-11-25', ['2017-11-26', '2017-11-28', '2017-12-03'])
rr = retention_rate(df, load_date=load_date)

# 用户活跃天数频次
active_days = user_visit.groupby('visit_days')['user_id'].count().reset_index(name='count')

# 将活跃天数低的数据合并(1-3天)
low_active = active_days[active_days['visit_days'].isin([1,2,3])]['count'].sum()
high_active = active_days[active_days['visit_days'] >= 4].copy()
merged_active = pd.concat([
    pd.DataFrame({'visit_days': ['1-3天'], 'count': [low_active]}),
    high_active
], ignore_index=True)

fig, ax = plt.subplots(1, 2, figsize=(12, 6))

ax[0].pie(
    merged_active['count'],
    labels=merged_active['visit_days'].values,
    autopct='%1.2f%%',
    pctdistance=0.85,
    startangle=180,
    textprops={'fontsize': 12}
)
ax[0].set_title('用户活跃天数分布(合并1-3天)')

ax[1] = sns.barplot(data=active_days, x='visit_days', y='count', width=0.5)
for bar in ax[1].patches:
    height = bar.get_height()
    ax[1].text(
        bar.get_x() + bar.get_width()/2,
        height + 0.1,
        f"{int(height)}",
        ha='center',
        va='bottom',
        fontsize=12
    )
ax[1].set_title("用户活跃天数频次分布")
ax[1].set_xlabel("活跃天数")
ax[1].set_ylabel("人数")
ax[1].grid(axis='y', linestyle='--', alpha=0.7)

plt.tight_layout()
plt.savefig('retention.png', dpi=300, bbox_inches='tight')
plt.show()
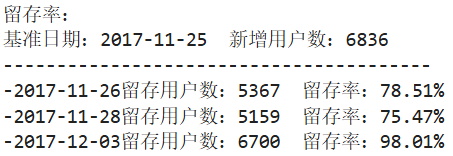
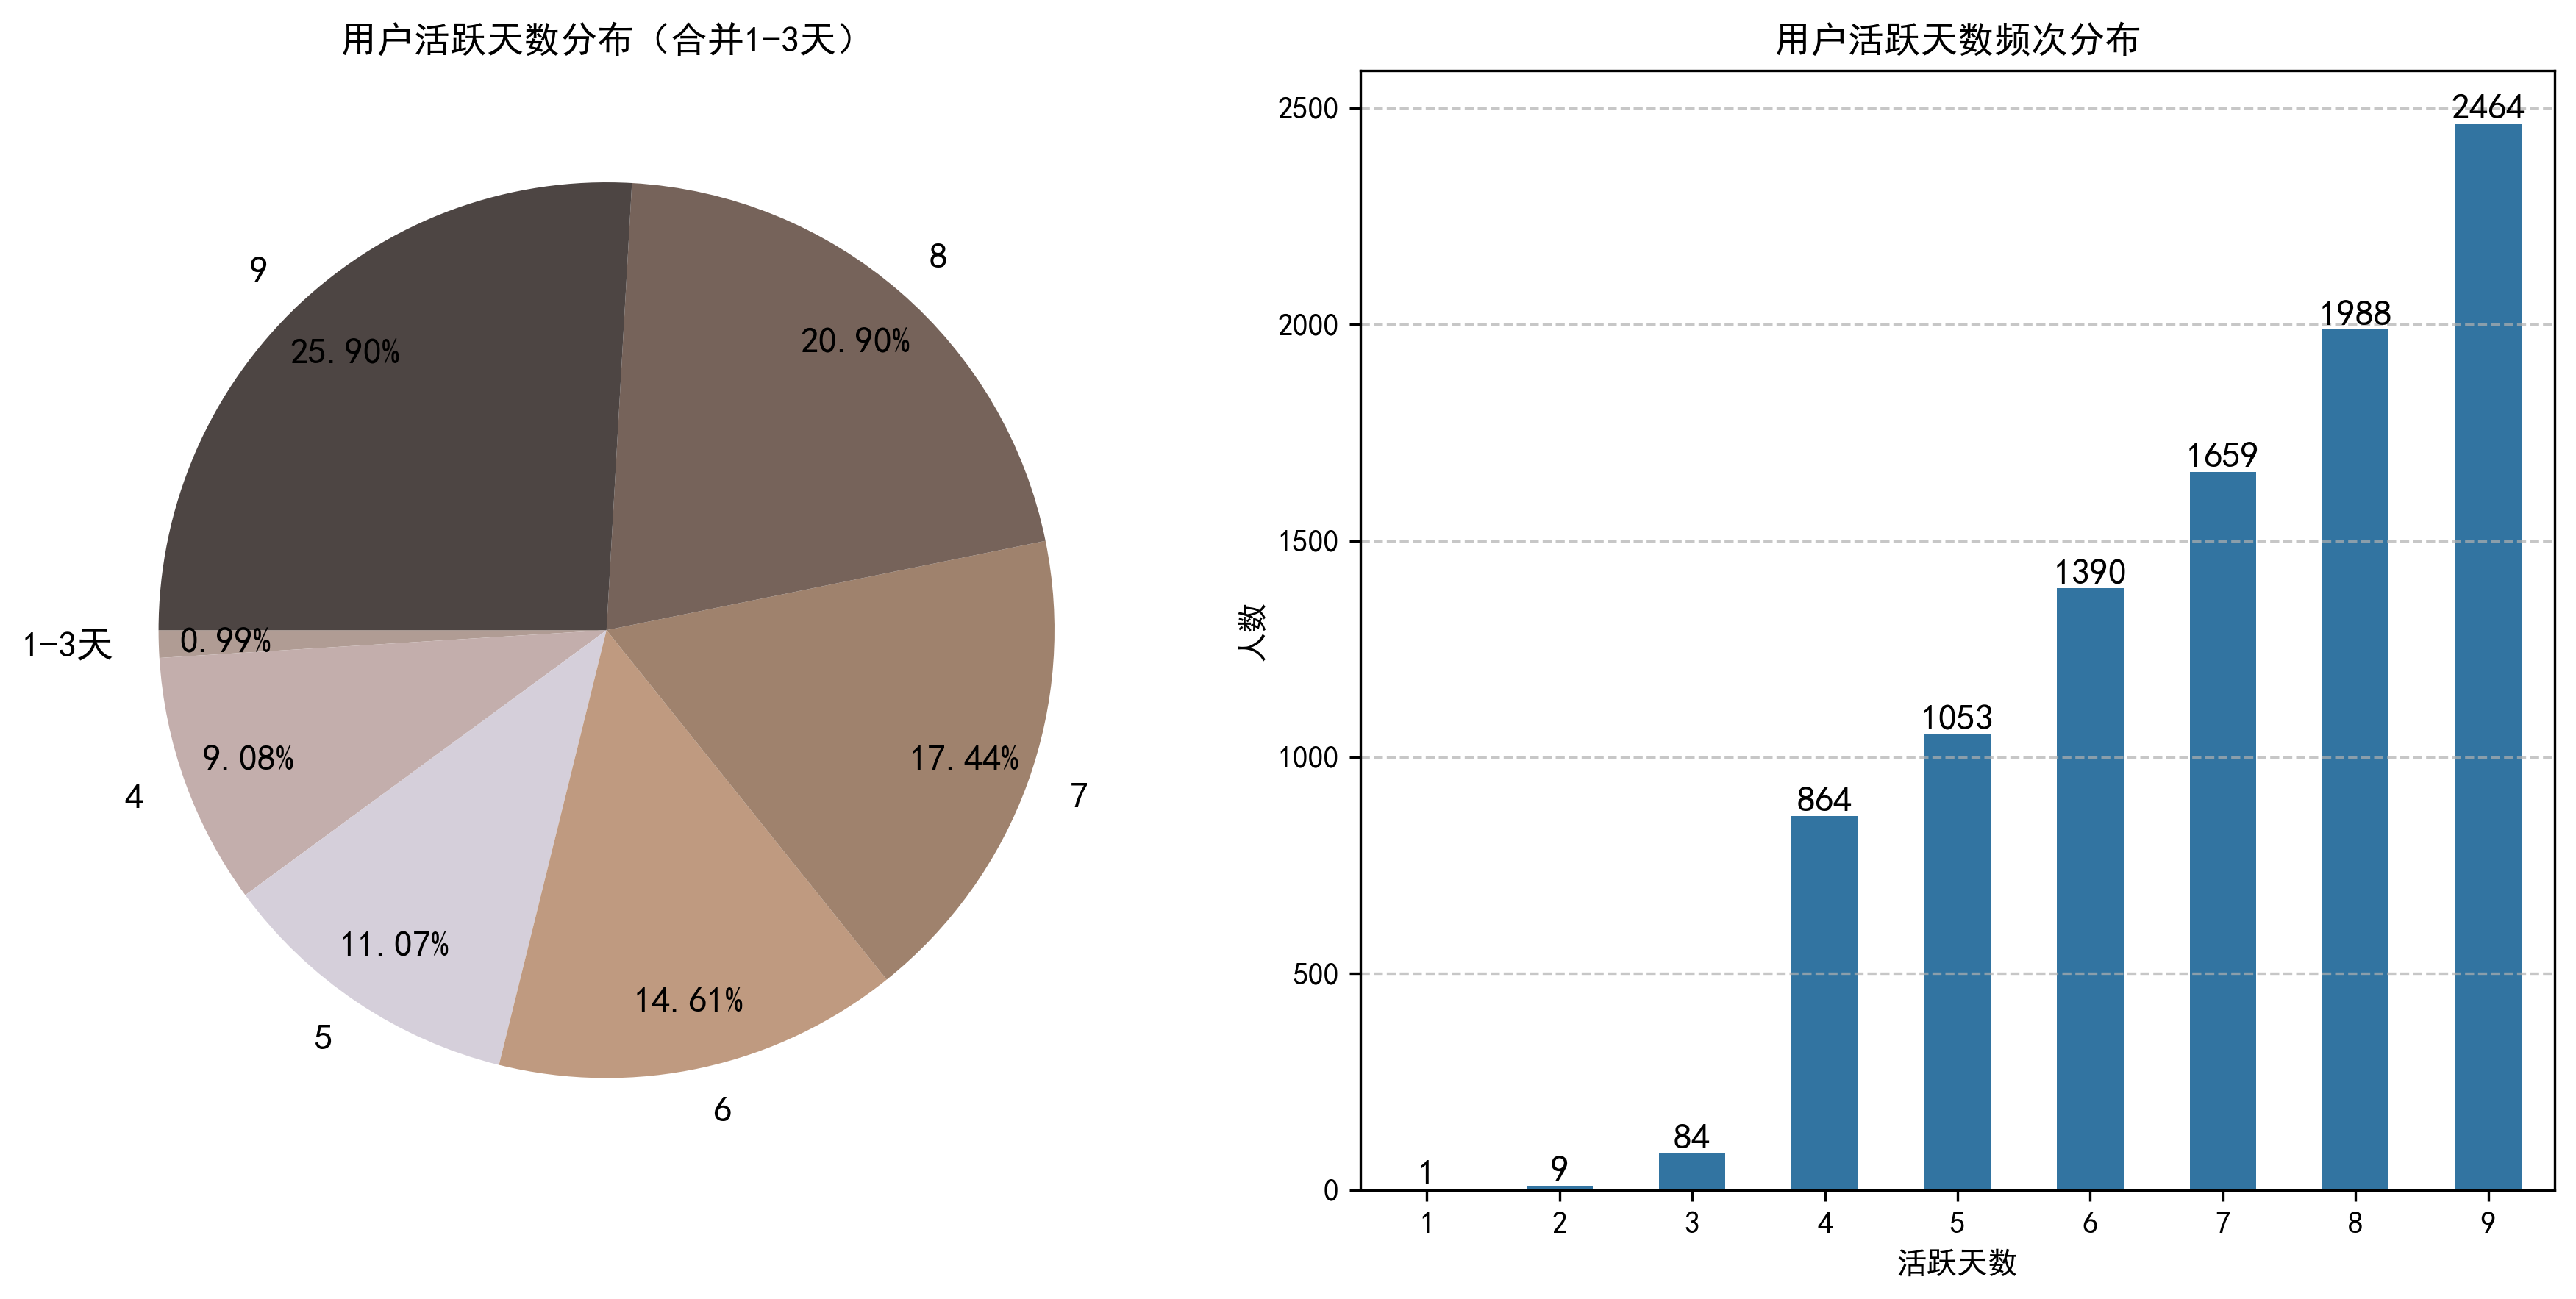
从留存率来看,平台日常核心指标体现出极高的用户粘性与转化潜力。活跃天数分布显示,超64%的用户在9天观测期内活跃7天及以上,其中9天活跃用户占比25.90%,1-3天低活跃用户仅占0.99%,几乎无一次性访客。
分析:该分布受双十二预热活动驱动明显,既体现了活动对用户活跃度的拉动作用,也印证了平台本身的高用户粘性与转化潜力,为后续运营提供了坚实支撑。
2.4 Revenue:商业变现
2.4.1 用户购买频次
# 购买用户数量及占比
user_bought = df[df['behavior_type']=='buy']['user_id'].nunique()
user_bought_ratio = user_bought / uv * 100

# 复购率
user_behavior_times = df.groupby('user_id')['behavior_type'].value_counts().unstack(fill_value=0)
user_buy_more_times = user_behavior_times[user_behavior_times['buy']>1].shape[0]
user_bought = user_behavior_times[user_behavior_times['buy']>0].shape[0]
repuchase_rate = user_buy_more_times / user_bought * 100

# 购买频次
buy_user_count = user_behavior_times['buy'].value_counts().sort_index().reset_index()

# 将购买频次高的数据合并(>5次)
low_buy = buy_user_count[buy_user_count['buy']<=5].copy()
high_buy = buy_user_count[buy_user_count['buy']>=6]['count'].sum()
merged_buy = pd.concat([
    pd.DataFrame({'buy': ['6次及以上'], 'count': [high_buy]}),
    low_buy
], ignore_index=True)

# 可视化
fig, ax = plt.subplots(2, 1, figsize=(8, 8))

sns.barplot(data=buy_user_count, x='buy', y='count', ax=ax[0])
for bar in ax[0].patches:
    height = bar.get_height()
    ax[0].text(
        bar.get_x() + bar.get_width()/2,
        height + 0.1,
        f"{int(height)}",
        ha='center',
        va='bottom',
        fontsize=8
    )
ax[0].set_title("用户购买频次分布")
ax[0].set_xlabel("购买次数")
ax[0].set_ylabel("人数")
ax[0].grid(axis='y', linestyle='--', alpha=0.7)

ax[1].pie(
    merged_buy['count'],
    labels=merged_buy['buy'].values,
    autopct='%1.2f%%',
    colors=['#BC4626', '#C4AF7E', '#A39884', '#404E75', '#837A72', '#646685', '#DEDDD2'],
    pctdistance=0.85,
    startangle=180,
    textprops={'fontsize': 12}
)
ax[1].set_title('用户购买频次分布(合并1-5次)')

plt.tight_layout()
plt.savefig('user_buy_times.png', dpi=300, bbox_inches='tight')
plt.show()
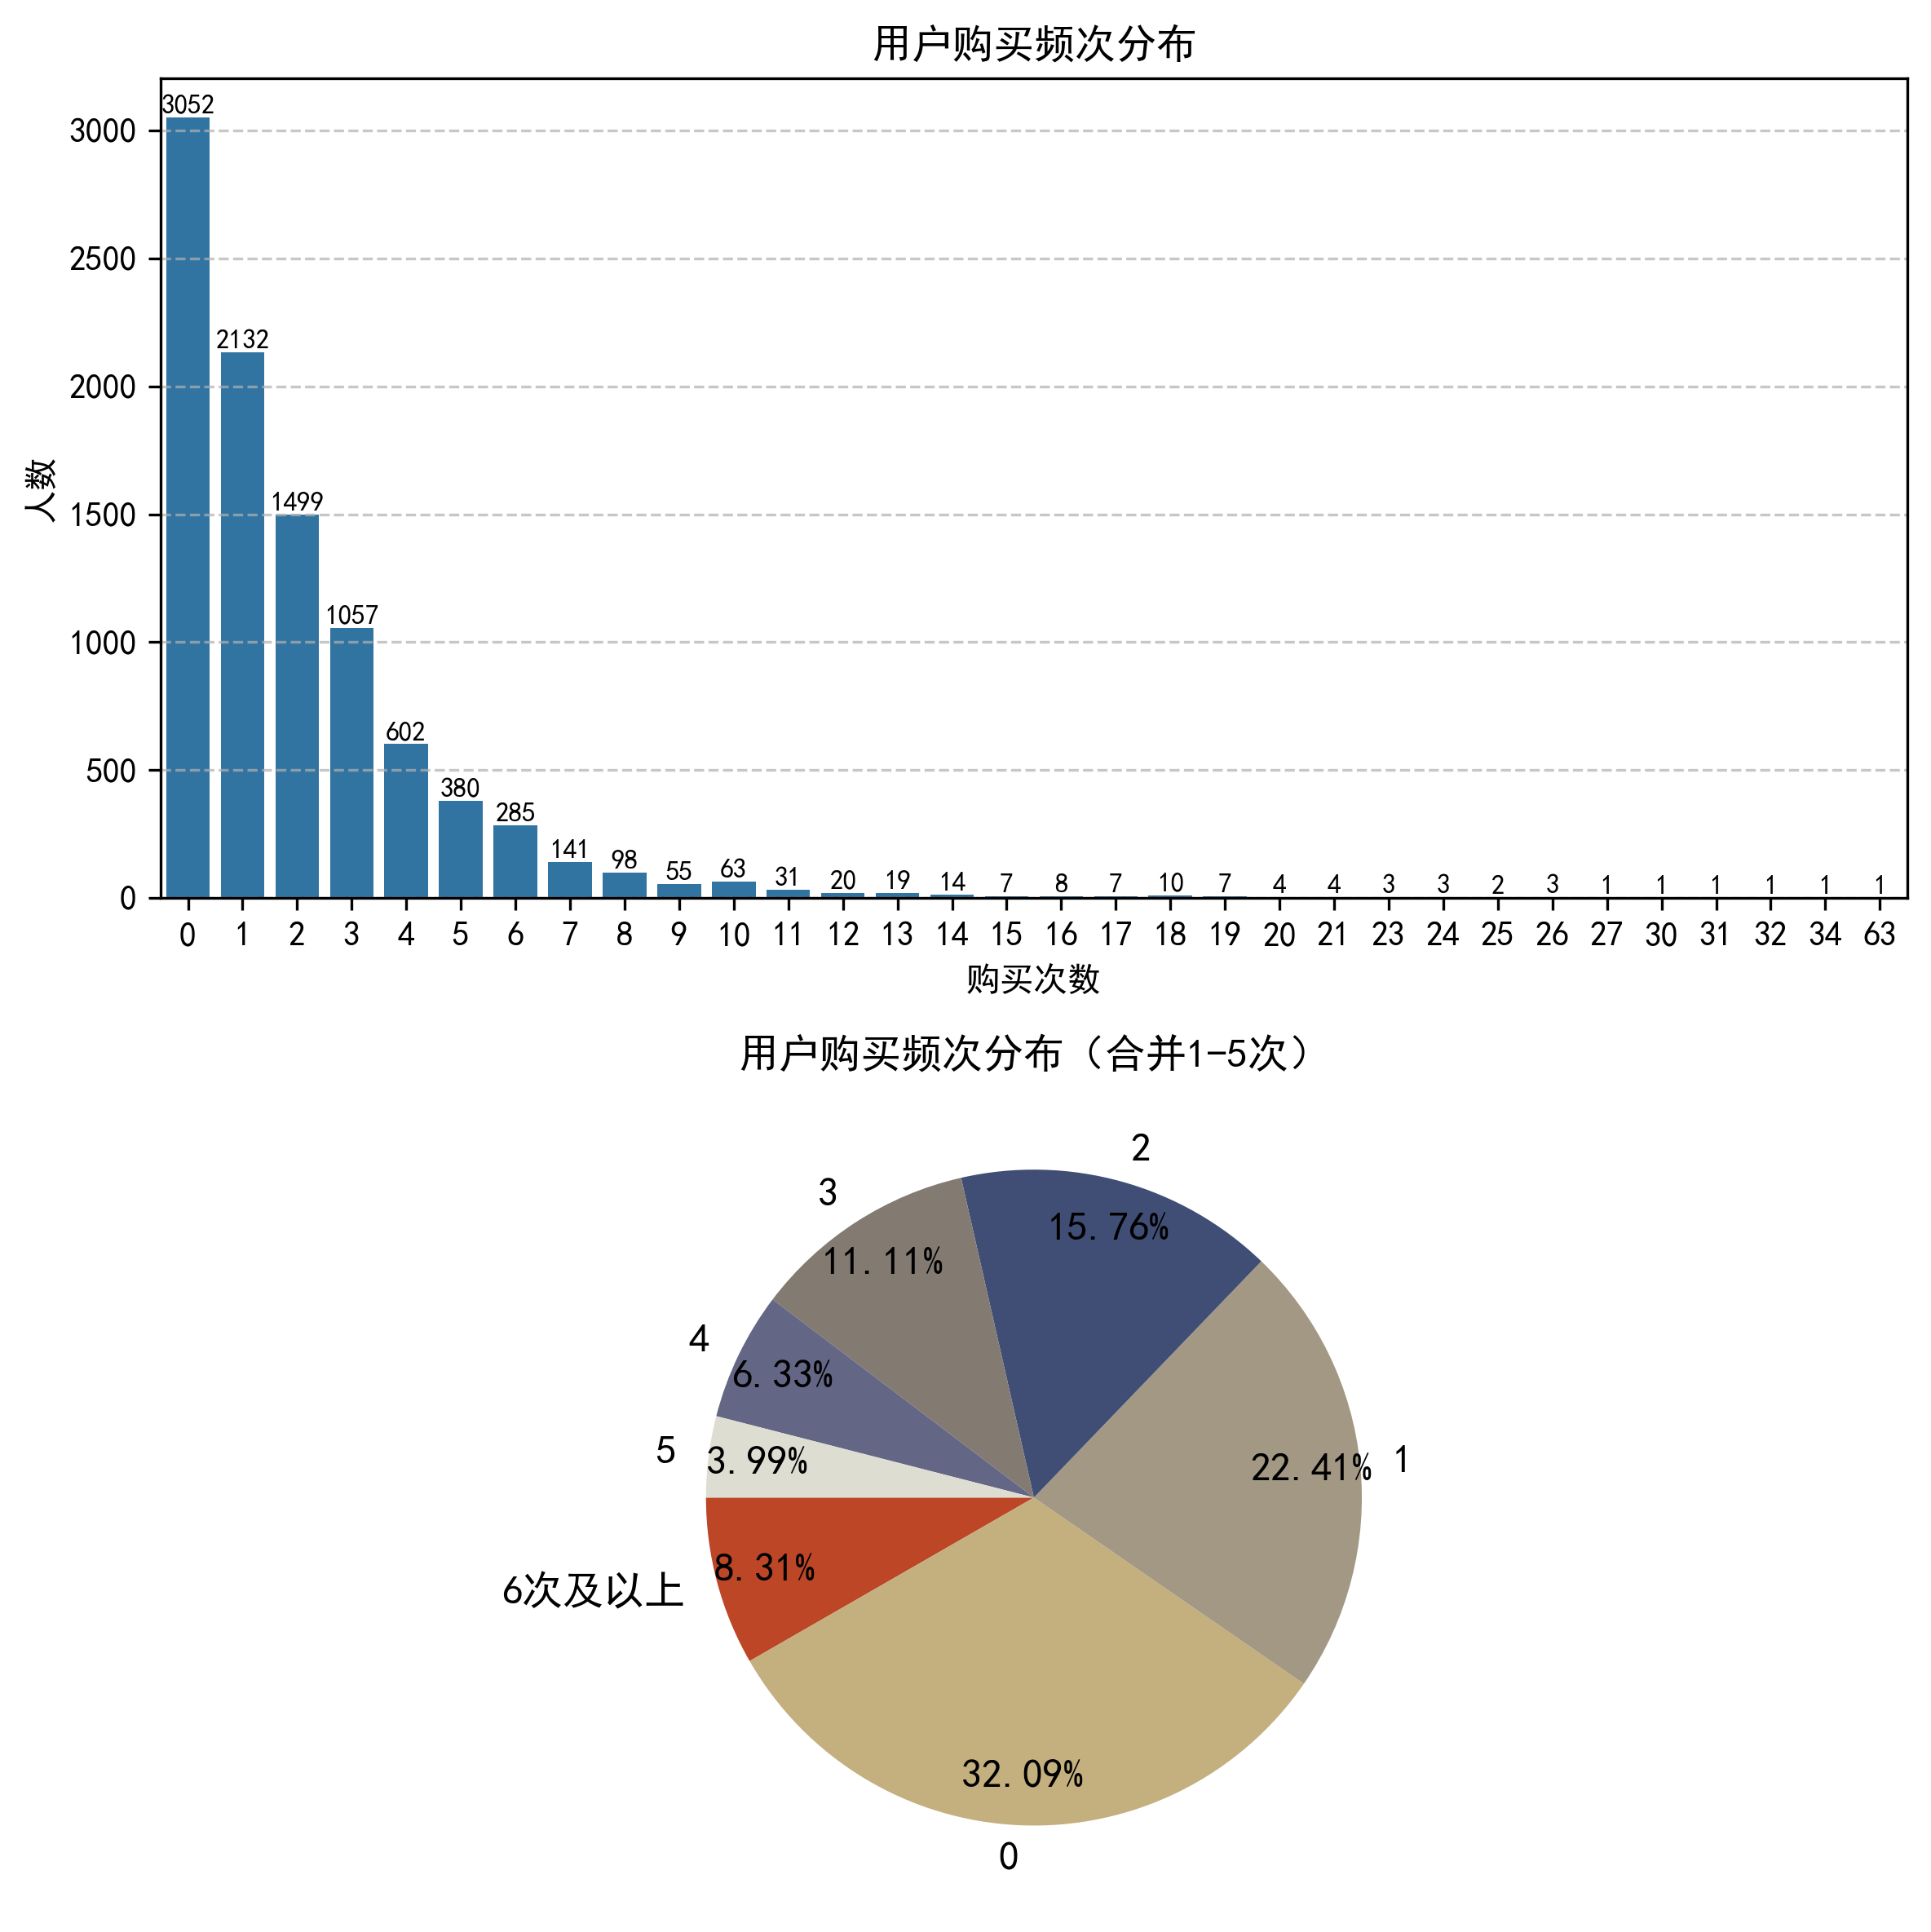
从用户购买频次分布来看,样本用户消费行为符合电商长尾规律:未购买用户占比32.09%,首购用户占22.41%,2-5次稳定复购用户合计占37.19%,6次及以上高复购用户仅占8.31%。
分析:该分布体现了双十二活动对用户消费的拉动作用,也反映出平台具备充足的转化提升空间,高复购用户作为核心价值群体,是后续精细化运营的重点。
2.4.2 用户行为转化漏斗
# 用户行为占比
behavior_type = df['behavior_type'].value_counts().reset_index()
plt.figure(figsize=(4, 4))
plt.pie(
    behavior_type['count'],
    labels=behavior_type['behavior_type'].values,
    autopct='%1.2f%%',
    pctdistance=1.5
)
plt.title('用户行为占比')
plt.savefig('pie_behavior.png', dpi=300, bbox_inches='tight')
plt.show()
total = behavior_type['count'].iloc[0]
behavior_type['persentage'] = (behavior_type['count'] / total * 100).round(2)
behavior_type['label_text'] = behavior_type.apply(
    lambda x: f"{x['behavior_type']}<br>{x['persentage']}%", axis=1)

# 绘制漏斗图
fig = go.Figure(go.Funnel(
    y=behavior_type['behavior_type'],
    x=behavior_type['count'],
    text=behavior_type['label_text'],
    textposition='auto',
    textfont=dict(size=10, color='black'),
    marker={'color': ['deepskyblue', 'lightskyblue', 'lightblue', 'lightsteelblue']}
))

fig.update_layout(
    title="用户行为转化漏斗图",
    title_x=0.5,
    width=1000,
    height=600,
)

fig.show()
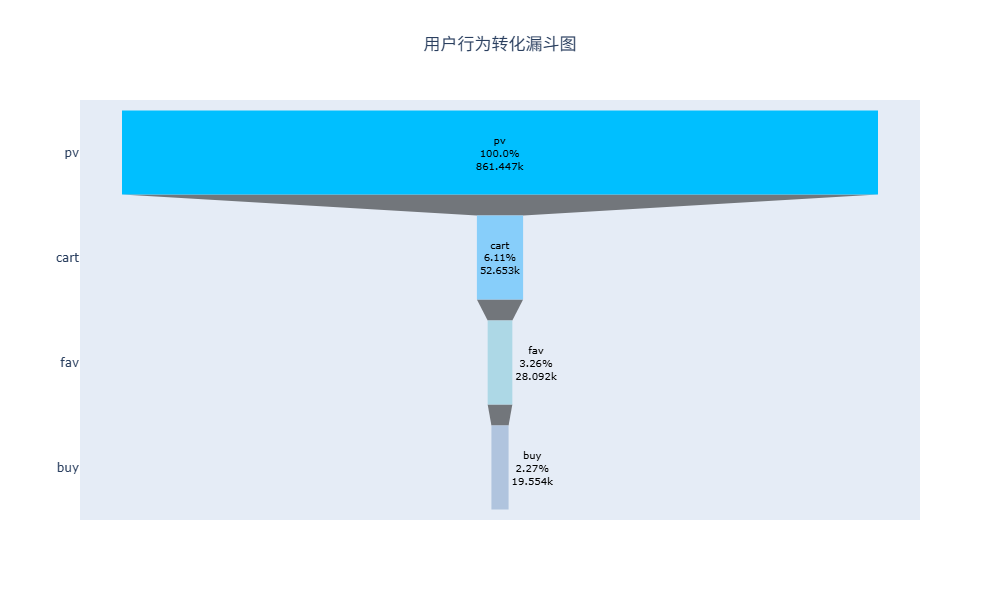
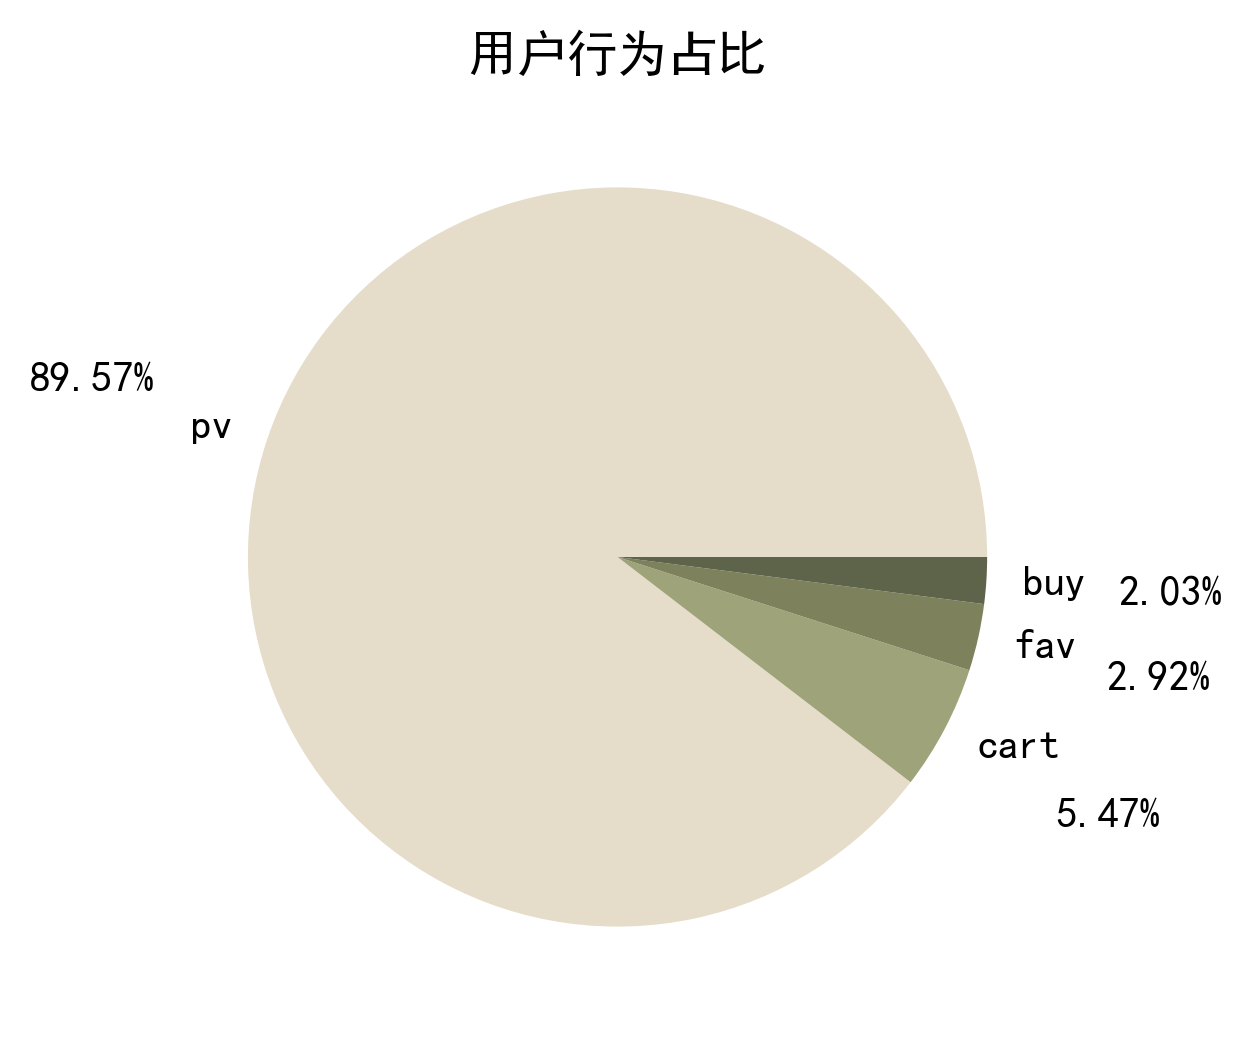
从用户行为占比可以清晰看出,用户行为量级呈现 pv > cart > fav > buy 的递减规律,整体符合典型的电商流量转化漏斗模型。
从用户行为转化漏斗可见,首环节浏览→加购流失最严重,是转化核心瓶颈;后端加购→购买转化效率较高,收藏用户购买转化率近70%,体现出平台商品对高意向用户的强吸引力,同时也具备极大的前端转化提升空间。
2.5 小结
①平台用户粘性较强,整体转化潜力充足
②平台促销活动引流与转化效果显著
③转化的核心瓶颈集中在浏览→加购环节
3. RFM模型分析
# R
end_date = df['date'].max()
R = df.groupby('user_id')['date'].max().reset_index()
R['R'] = (end_date - R['date']).dt.days

# F
df_buy = df[df['behavior_type']=='buy']
F = df_buy.groupby('user_id').size().reset_index(name='F')

rfm = R.merge(F, how='left', on='user_id')[['user_id', 'R', 'F']].fillna(0)

# 打分规则:
# R:3天内登录过用户为1分,大于3天为0分
# F:基于前文用户购买频次数据界定,购买次数小于等于5次为0分, 大于5次为1分
bins = {
    'R': [-float('inf'), 2, float('inf')],
    'F': [-float('inf'), 5, float('inf')]
}

labels = {
    'R': [1, 0],
    'F': [0, 1]
}

for col in ['R', 'F']:
    rfm[f'{col}_score'] = pd.cut(rfm[col], bins=bins[col], labels=labels[col], right=True)\
        .astype(int)

rfm['rfm_label'] = rfm['R_score'].astype(str) + rfm['F_score'].astype(str)

# 用户分层
def rfm_classify(row):
    R = row['R_score']
    F = row['F_score']

    if R==1 and F==1:
        return '重要价值用户'
    elif R==0 and F==1:
        return '重要保持用户'
    elif R==1 and F==0:
        return '重要发展用户'
    else:
        return '重要挽留用户'

rfm['user_type'] = rfm.apply(rfm_classify, axis=1)

user_class = rfm['user_type'].value_counts().reset_index()
print(user_class)

plt.figure(figsize=(5, 4))
plt.pie(user_class['count'],
        labels=user_class['user_type'].values,
        autopct='%1.1f%%',
        colors=['#177CB0', '#9d2933', '#057748']
)

plt.savefig('RFM.png', dpi=300, bbox_inches='tight')
plt.show()
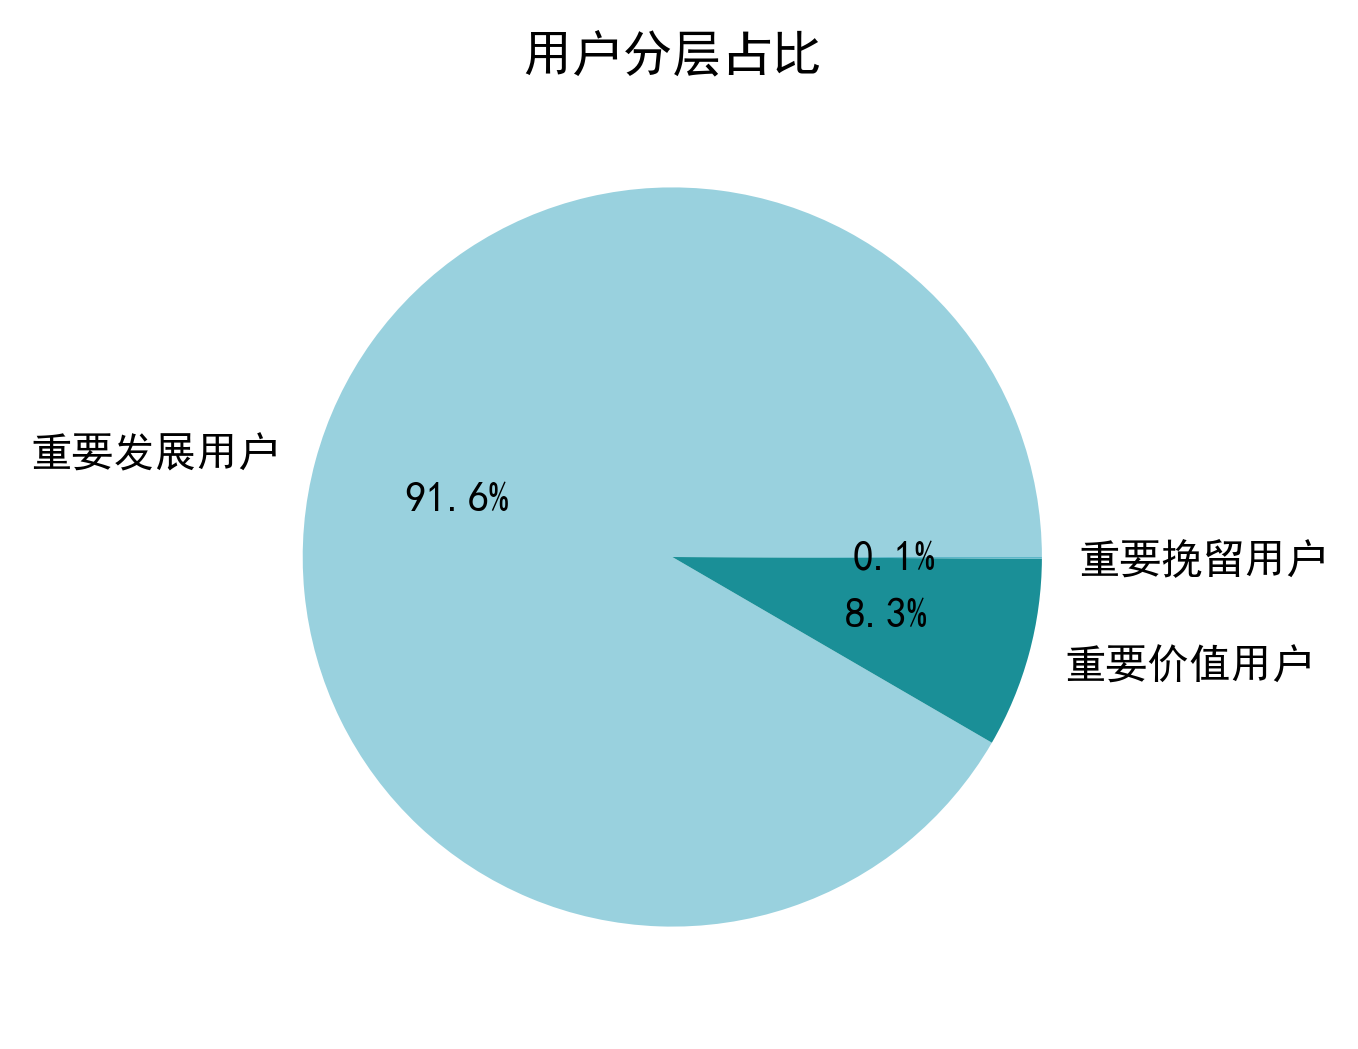
从用户分层占比来看,平台用户结构健康:重要发展用户占比高达91.6%,是核心增长群体;重要价值用户占 8.3%,为核心营收贡献者;重要挽留用户仅占0.1%,流失风险极低。
本次分层未划分出重要保持用户,说明该类用户占比可忽略。
3.1 小结
①重要发展用户占比高达91.6%,平台整体增长潜力充足
②重要价值用户占比合理,是核心营收支柱,重要挽留用户占比极低,用户流失风险可控
4. 商品分析
4.1 商品SKU动销率
# 计算已售商品占比
product_quantity = df['item_id'].nunique()
product_sold = df[df['behavior_type']=='buy']['item_id'].nunique()
product_sold_rate = product_sold / product_quantity
print(f"""
在售商品数量:{product_quantity}
已售商品数量:{product_sold}
已售商品占比:{product_sold_rate:.2f}%
""")
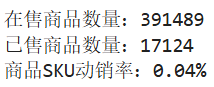
本次观测期内,平台在售商品共391489件,其中已售商品17124件,SKU动销率仅0.04%。
商品销售频次分布数据如下:
# 商品销量分布
product_sales = product_performance['buy'].value_counts().reset_index(name='count')

plt.figure(figsize=(6, 4))

ax = sns.barplot(data=product_sales, x='buy', y='count')

for bar in ax.patches:
    height = bar.get_height()
    ax.text(
        bar.get_x() + bar.get_width()/2,
        height + 0.1,
        f"{int(height)}",
        ha='center',
        va='bottom',
        fontsize=10
    )

plt.title("商品销售频次分布")
plt.xlabel("销售次数")
plt.ylabel("商品数量")
plt.grid(axis='y', linestyle='--', alpha=0.7)

plt.savefig('product_sales.png', dpi=300, bbox_inches='tight')
plt.show()
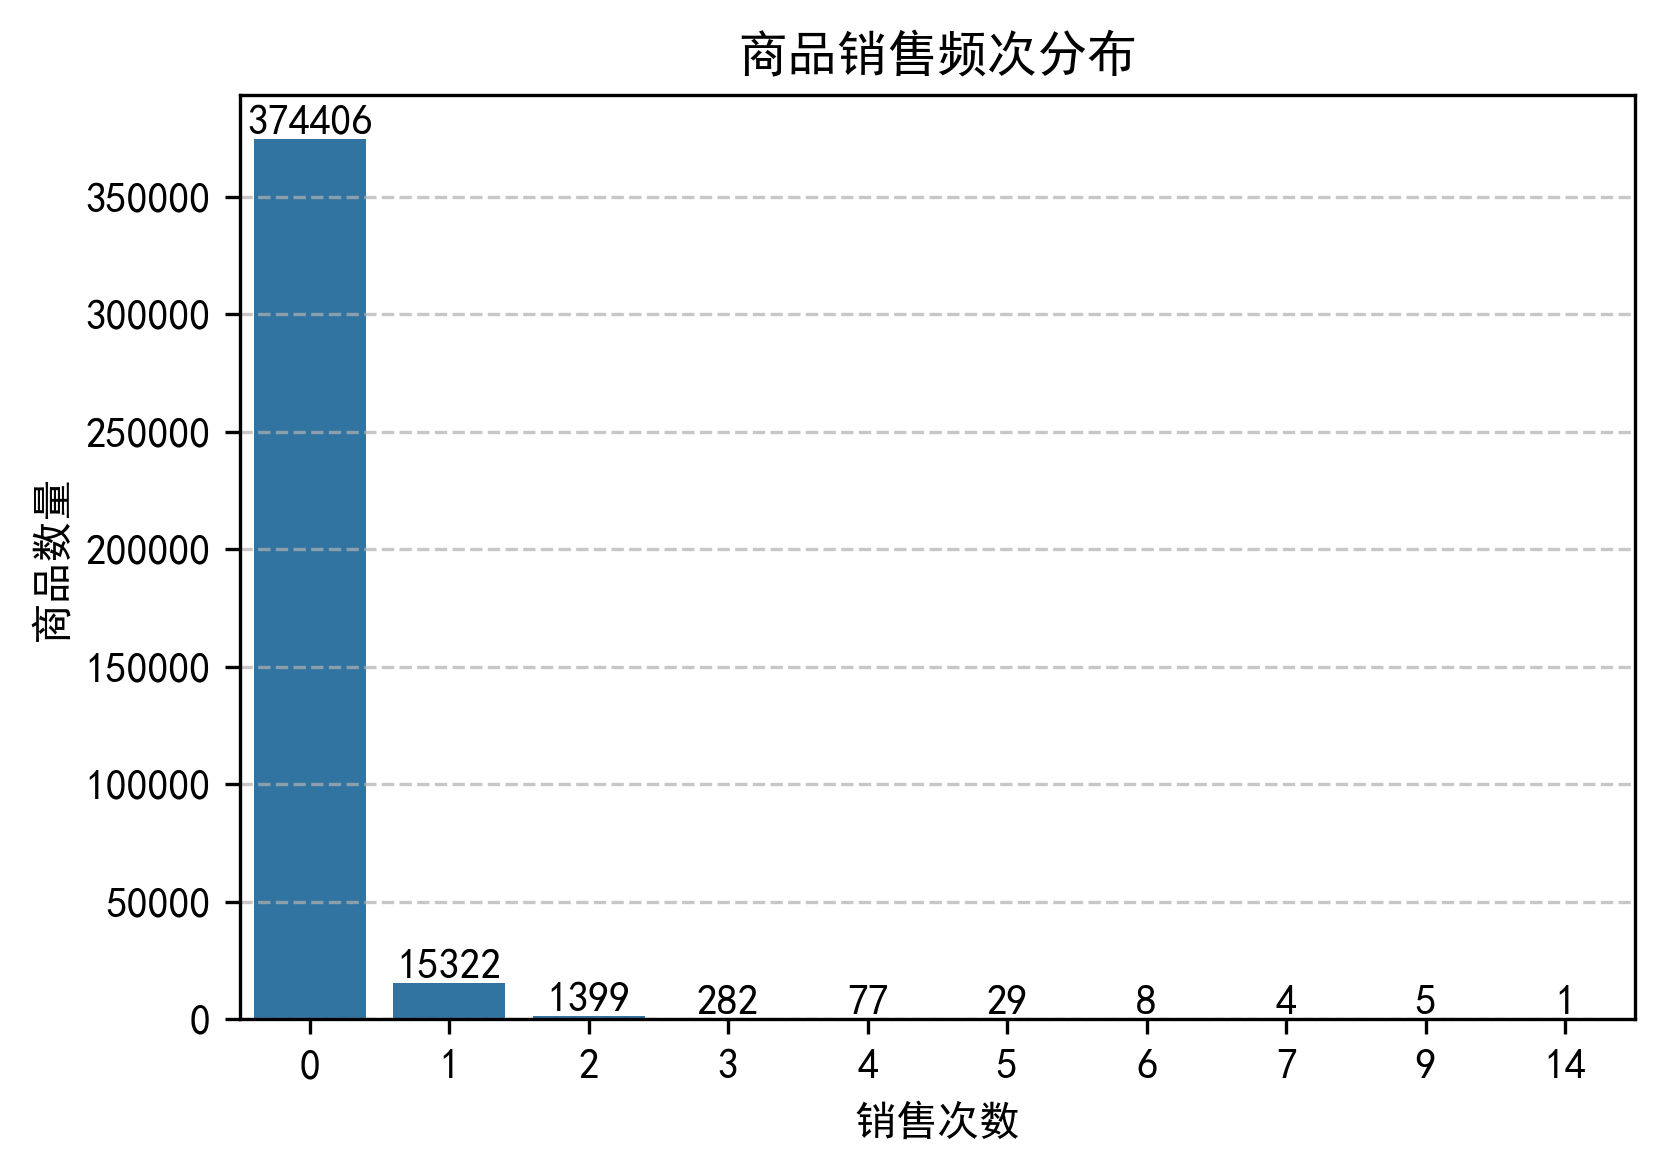
分析:从商品销售频次分布来看,平台商品呈现极端长尾结构,95.65%的商品销售0次,仅不足0.5%的商品销售2次及以上,动销率极低,商品结构问题突出。
4.2 品类分析
# 按销售量
category_performance = product_sorted.groupby('category_id').agg({
    'item_id': 'count',
    'buy': ['sum', 'mean']
}).reset_index()
category_performance.columns = ['商品类目', '内含商品数', '类目总销量', '类目平均销量']

# 类目销量前10,类目内商品销量前3
product_sorted = product_sorted[product_sorted['buy']>0]
product_sorted['类目内销量占比'] = product_sorted.apply(
    lambda row: (row['buy'] / product_sorted[product_sorted['category_id']==row['category_id']]['buy']
        .sum()) * 100,
    axis=1
).round(2)

top10_categories = category_abc_performance.head(10)['商品类目'].tolist()
df_top10_category = product_sorted[product_sorted['category_id'].isin(top10_categories)].copy()

def get_top3_products(group):
    return group.sort_values(by='buy', ascending=False).head(3).reset_index(drop=True)

include_columns = ['item_id', 'category_id', 'buy', 'cart', 'fav', 'pv', '类目内销量占比']
top3_products_per_category = df_top10_category.groupby('category_id')[include_columns]\
    .apply(get_top3_products, include_groups=True)\
    .reset_index(drop=True)

top3_products_per_category['isin_products_top30'] = top3_products_per_category['item_id'].isin(
    product_sorted.head(30)['item_id']
).astype(int)

# 商品销售树形图
fig = px.treemap(
    top3_products_per_category,
    path=['category_id', 'item_id'],
    values='类目内销量占比',
    color='isin_products_top30',
    color_continuous_scale=['lightblue', 'darkblue']
)

fig.update_layout(
    title={
        'text': '商品销售树形图(销量占比)',
        'x': 0.5,
        'xanchor': 'center'
    },
    width=800,
    height=500,
    coloraxis_colorbar=dict(
        title="是否TOP30",
        tickvals=[0, 1],
        ticktext=["否", "是"]
    )
)
fig.show()
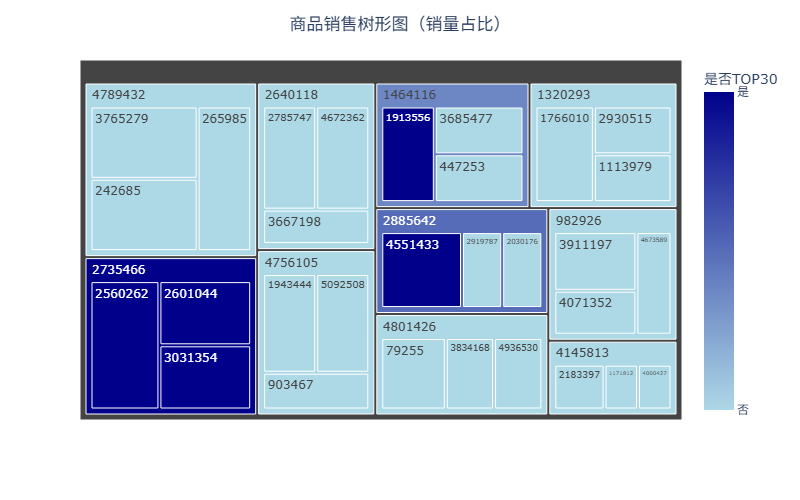
从商品销售树形图可见,销量高度集中于少数爆款,其中2735466为核心头部爆款,呈现极端头部集中效应。
分析:该结构符合电商【80 / 20法则】,少数头部商品贡献绝大多数销量,体现了平台爆款的强竞争力,反映出长尾商品冗余、动销率低的问题。
4.3 小结
①商品动销率极低,SKU冗余问题突出,商品结构严重失衡
②销量呈现极端头部集中效应,少数爆款贡献绝大多数销量,长尾商品运营效率待提升
五、优化建议
1.针对用户行为时间
(1)活动期错峰资源倾斜
①将核心推广资源优先分配至周末。
②工作日针对性做预热蓄水,推送周末活动提醒。
(2)高峰时段精细化运营
①早高峰(通勤时段)侧重推送爆款、活动提醒。
②晚高峰(18:00-21:00)加大流量投放、推送限时福利
2.针对用户转化链路
(1)提升前端转化
①针对浏览未加购用户,发放限时优惠券、满减福利,刺激加购。
②个性化推荐高匹配度商品,提升用户兴趣,缩短浏览→加购的转化路径
(2)强化全链路转化
①活动期针对用户做分层运营,发放专属券,提升全链路转化效率。
②活动后针对活动期高活跃用户,做复购运营,将活动流量转化为长期用户粘性。
3.针对用户分层
(1)重要价值用户
①推出VIP专属权益、定制化服务,锁定高价值用户终身价值。
②邀请参与新品试用、活动共创,强化用户忠诚度。
(2)重要发展用户
①发放首单 / 复购优惠券、展示会员权益,刺激购买,向重要价值用户转化。
②基于用户行为做精准推荐,提升转化效率,培养长期消费习惯。
(3)重要挽留用户
针对 0.1% 的低占比挽留用户,做个性化召回推送,发放专属召回券。
4.针对商品结构
(1)优化商品结构,精简SKU
①批量清理零动销、长期滞销的长尾商品,将SKU总量压缩至合理区间,提升整体动销率。
②倾斜供应链与运营资源,聚焦高动销、高转化的爆款品类,强化核心品类竞争力。
(2)强化爆款运营,放大头部效应
①针对头部爆款(如2735466),加大流量扶持、活动资源,放大其营收贡献。
②挖掘同类潜力商品,打造爆款矩阵。
③优化爆款供应链,保障库存,避免断货。
(3)长尾商品精细化运营
①针对有潜力的长尾商品,通过优惠券、推荐扶持,提升动销率;对无潜力的长尾商品,强制下架。
②降低零动销商品的推荐权重,优先推送高动销爆款,提升用户匹配度与平台运营效率。
六、参考文献
淘宝用户数据分析与可视化:https://tianchi.aliyun.com/notebook/731843

AtomGit 是由开放原子开源基金会联合 CSDN 等生态伙伴共同推出的新一代开源与人工智能协作平台。平台坚持“开放、中立、公益”的理念,把代码托管、模型共享、数据集托管、智能体开发体验和算力服务整合在一起,为开发者提供从开发、训练到部署的一站式体验。
更多推荐
 13
13 0
0- 0


 已为社区贡献1条内容

所有评论(0)