可视化数据分析 - 基于OpenHarmony Flutter的财务洞察
·
更新概述
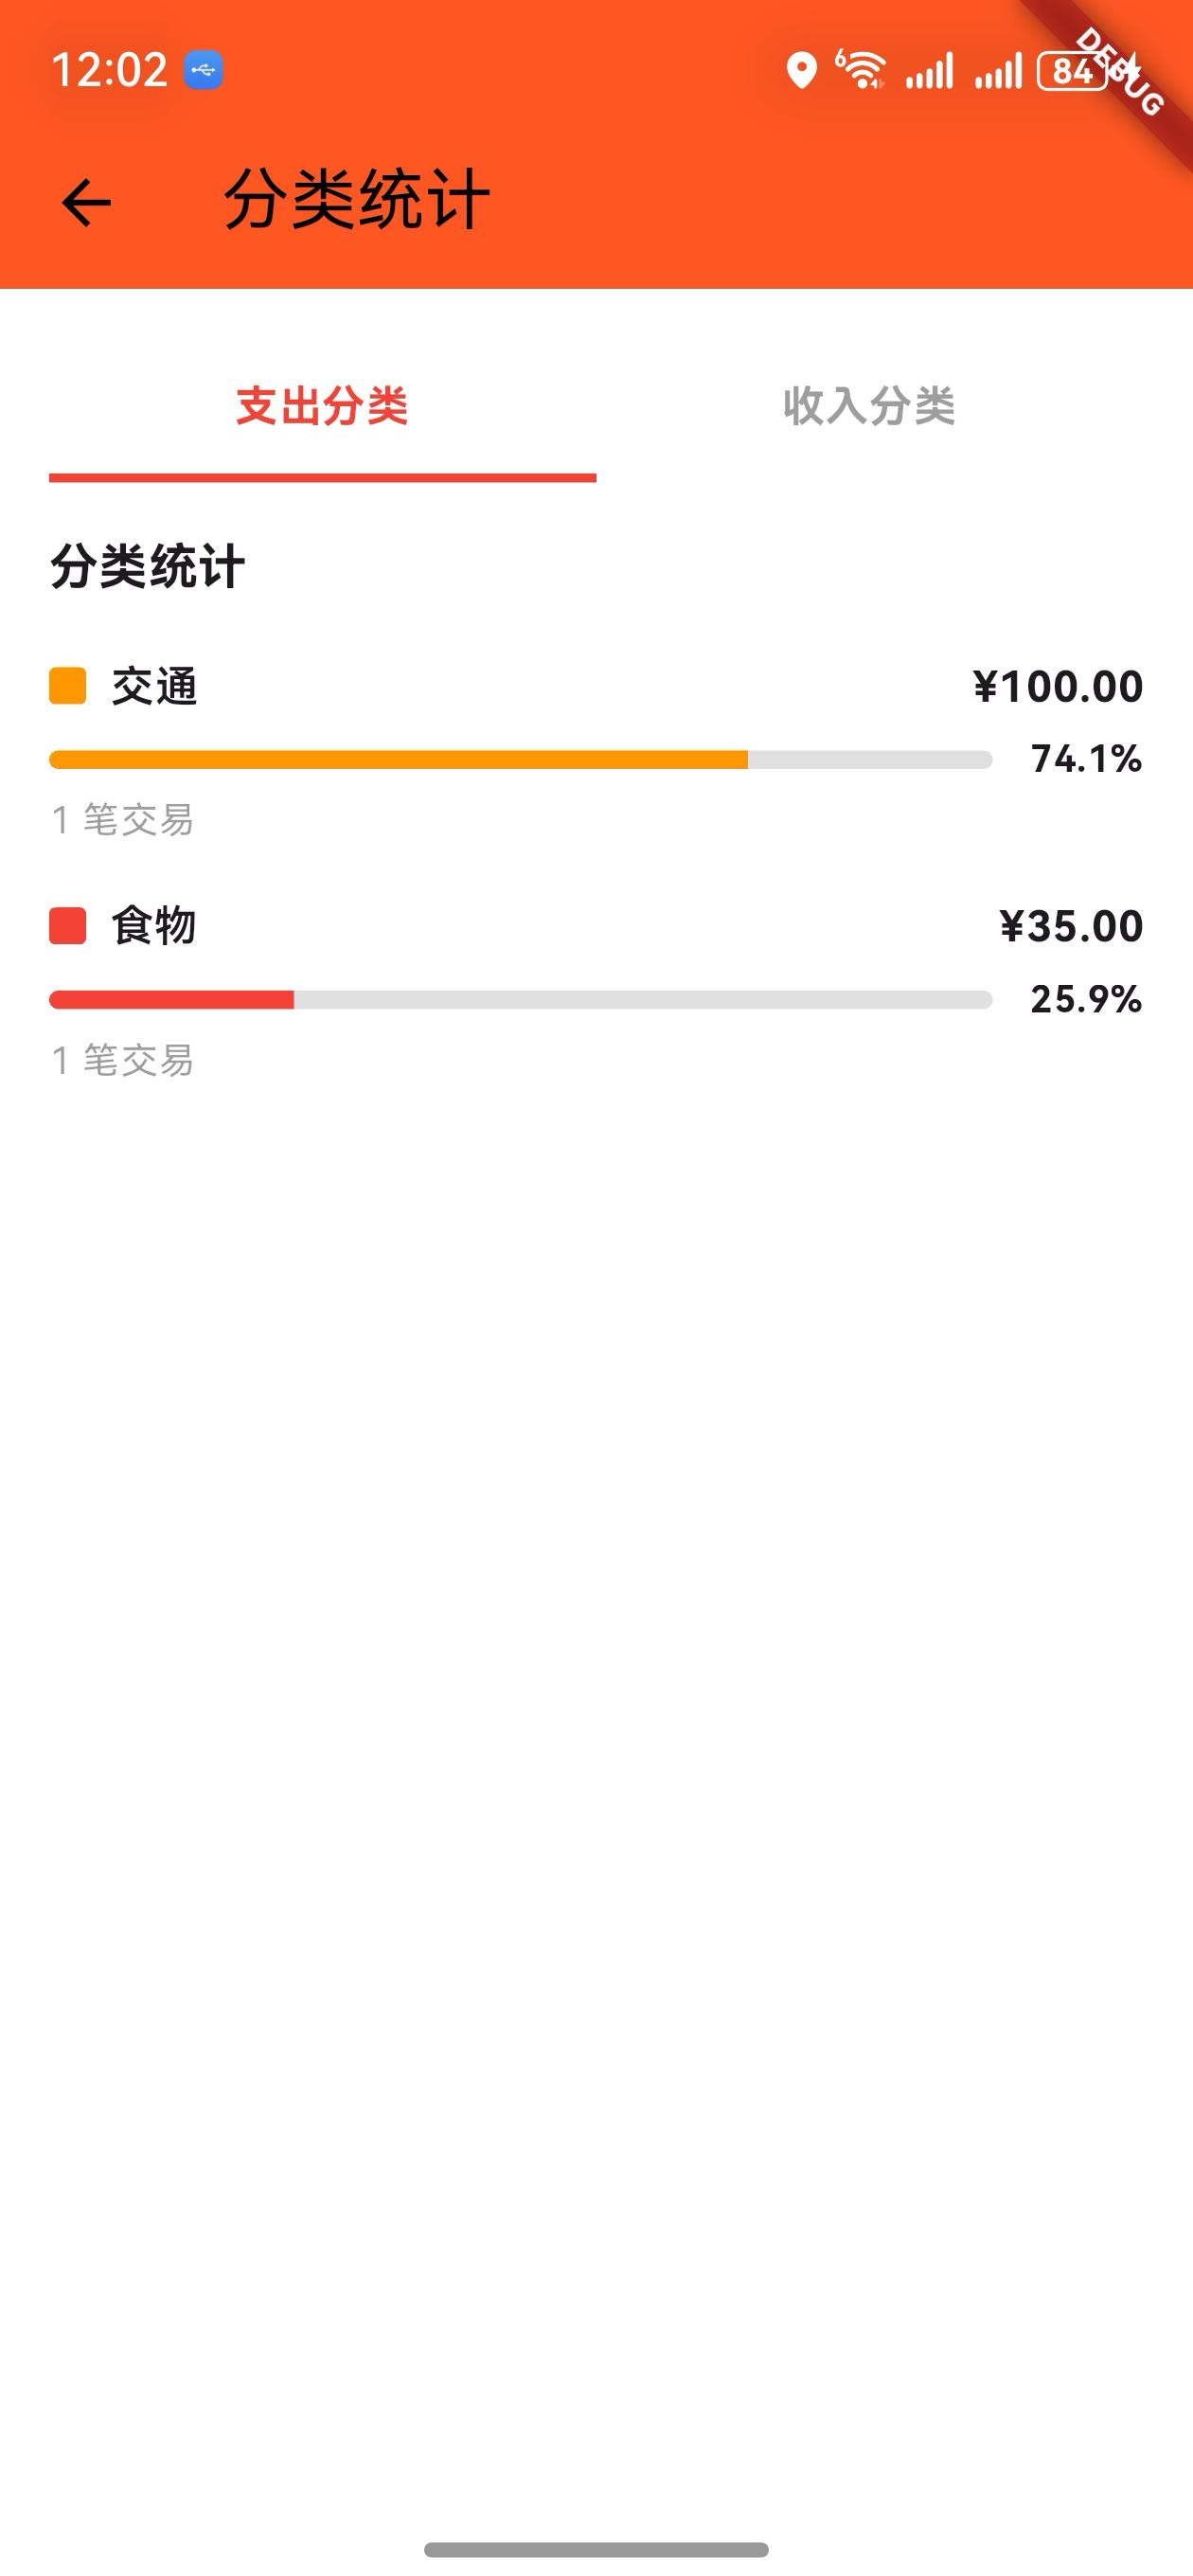
v1.17.0 版本为 OpenHarmony 钱包应用增加了分类统计图表功能。用户现在可以通过月度统计页面的图表按钮查看支出和收入的分类分布,以进度条的形式直观展示各分类的占比。这个新功能帮助用户快速了解消费结构。

核心功能更新
1. 分类统计数据模型
CategoryStatData 类定义
/// 分类统计数据模型
class CategoryStatData {
  final String category;
  final double amount;
  final int count;
  final Color color;

  CategoryStatData({
    required this.category,
    required this.amount,
    required this.count,
    required this.color,
  });

  /// 获取百分比
  double getPercentage(double total) {
    return total > 0 ? (amount / total * 100) : 0;
  }
}
说明:
- 记录分类名称、金额、交易笔数
- 记录该分类的颜色
- 提供百分比计算方法
2. 分类统计服务
CategoryStatService 类
/// 分类统计服务
class CategoryStatService {
  /// 获取支出分类统计
  static List<CategoryStatData> getExpenseStats(
    List<wallet.Transaction> transactions,
    DateTime startDate,
    DateTime endDate,
  ) {
    // 按分类统计支出
    // 分配颜色
    // 按金额排序
  }

  /// 获取收入分类统计
  static List<CategoryStatData> getIncomeStats(
    List<wallet.Transaction> transactions,
    DateTime startDate,
    DateTime endDate,
  ) {
    // 按分类统计收入
    // 分配颜色
    // 按金额排序
  }
}
说明:
getExpenseStats: 获取支出分类统计(红色系)getIncomeStats: 获取收入分类统计(绿色系)- 自动分配颜色和排序
支出分类颜色
| 颜色 | 说明 |
|---|---|
| 红色 | 第一分类 |
| 橙色 | 第二分类 |
| 黄色 | 第三分类 |
| 绿色 | 第四分类 |
| 蓝色 | 第五分类 |
3. 分类统计页面
标签选择器
/// 构建标签选择器
Widget _buildTabSelector() {
  return Padding(
    padding: const EdgeInsets.symmetric(horizontal: 16),
    child: Row(
      children: [
        Expanded(
          child: GestureDetector(
            onTap: () {
              setState(() {
                _selectedTab = 0;
              });
            },
            child: Container(
              padding: const EdgeInsets.symmetric(vertical: 12),
              decoration: BoxDecoration(
                border: Border(
                  bottom: BorderSide(
                    color: _selectedTab == 0 ? Colors.red : Colors.transparent,
                    width: 3,
                  ),
                ),
              ),
              child: Text(
                '支出分类',
                textAlign: TextAlign.center,
                style: TextStyle(
                  fontWeight: FontWeight.bold,
                  color: _selectedTab == 0 ? Colors.red : Colors.grey,
                ),
              ),
            ),
          ),
        ),
        Expanded(
          child: GestureDetector(
            onTap: () {
              setState(() {
                _selectedTab = 1;
              });
            },
            child: Container(
              padding: const EdgeInsets.symmetric(vertical: 12),
              decoration: BoxDecoration(
                border: Border(
                  bottom: BorderSide(
                    color: _selectedTab == 1 ? Colors.green : Colors.transparent,
                    width: 3,
                  ),
                ),
              ),
              child: Text(
                '收入分类',
                textAlign: TextAlign.center,
                style: TextStyle(
                  fontWeight: FontWeight.bold,
                  color: _selectedTab == 1 ? Colors.green : Colors.grey,
                ),
              ),
            ),
          ),
        ),
      ],
    ),
  );
}
说明:
- 两个标签:支出分类、收入分类
- 下划线指示当前选中标签
- 点击切换显示内容
分类列表
/// 构建分类列表
Widget _buildCategoryList(List<CategoryStatData> stats, double total) {
  return Padding(
    padding: const EdgeInsets.symmetric(horizontal: 16),
    child: Column(
      crossAxisAlignment: CrossAxisAlignment.start,
      children: [
        Text('分类统计', style: Theme.of(context).textTheme.titleMedium),
        const SizedBox(height: 16),
        ...stats.map((stat) {
          final percentage = stat.getPercentage(total);
          return Padding(
            padding: const EdgeInsets.only(bottom: 16),
            child: Column(
              crossAxisAlignment: CrossAxisAlignment.start,
              children: [
                Row(
                  mainAxisAlignment: MainAxisAlignment.spaceBetween,
                  children: [
                    Row(
                      children: [
                        Container(
                          width: 12,
                          height: 12,
                          decoration: BoxDecoration(
                            color: stat.color,
                            borderRadius: BorderRadius.circular(2),
                          ),
                        ),
                        const SizedBox(width: 8),
                        Text(stat.category, style: const TextStyle(fontWeight: FontWeight.w600)),
                      ],
                    ),
                    Text('¥${stat.amount.toStringAsFixed(2)}', style: const TextStyle(fontWeight: FontWeight.bold)),
                  ],
                ),
                const SizedBox(height: 6),
                Row(
                  children: [
                    Expanded(
                      child: LinearProgressIndicator(
                        value: percentage / 100,
                        minHeight: 6,
                        backgroundColor: Colors.grey.shade300,
                        valueColor: AlwaysStoppedAnimation<Color>(stat.color),
                      ),
                    ),
                    const SizedBox(width: 12),
                    Text('${percentage.toStringAsFixed(1)}%'),
                  ],
                ),
                const SizedBox(height: 4),
                Text('${stat.count} 笔交易', style: Theme.of(context).textTheme.bodySmall),
              ],
            ),
          );
        }).toList(),
      ],
    ),
  );
}
说明:
- 显示分类名称和金额
- 进度条显示占比
- 显示百分比和交易笔数
- 按金额从大到小排序
UI 变化
分类统计页面布局
┌─────────────────────────────────┐
│  分类统计                        │
├─────────────────────────────────┤
│  支出分类 | 收入分类             │
├─────────────────────────────────┤
│  分类统计                        │
│                                 │
│  🔴 食物           ¥800         │
│  [████████░░░░░░░░░░] 32%      │
│  5 笔交易                        │
│                                 │
│  🟠 交通           ¥500         │
│  [█████░░░░░░░░░░░░░░] 20%     │
│  3 笔交易                        │
│                                 │
│  🟡 娱乐           ¥300         │
│  [███░░░░░░░░░░░░░░░░░░] 12%   │
│  2 笔交易                        │
│                                 │
│  🟢 其他           ¥400         │
│  [██████░░░░░░░░░░░░░░] 16%    │
│  4 笔交易                        │
└─────────────────────────────────┘
访问方式
- 进入月度统计页面
- 点击 AppBar 右侧的图表按钮(📊)
- 进入分类统计页面
版本对比
| 功能 | v1.16.0 | v1.17.0 |
|---|---|---|
| 日历视图 | ✅ | ✅ |
| 月份导航 | ✅ | ✅ |
| 日期交易展示 | ✅ | ✅ |
| 分类统计模型 | ❌ | ✅ |
| 分类统计服务 | ❌ | ✅ |
| 支出分类统计 | ❌ | ✅ |
| 收入分类统计 | ❌ | ✅ |
| 进度条图表 | ❌ | ✅ |
| 标签切换 | ❌ | ✅ |
使用场景
场景 1:查看支出分类分布
- 进入月度统计页面
- 点击图表按钮
- 默认显示支出分类
- 查看各分类的占比和金额
场景 2:查看收入分类分布
- 进入分类统计页面
- 点击"收入分类"标签
- 查看收入的分类分布
- 了解收入结构
场景 3:对比支出结构
- 进入分类统计页面
- 查看支出分类
- 识别最高支出分类
- 调整消费策略
场景 4:了解交易笔数
- 进入分类统计页面
- 查看每个分类的交易笔数
- 了解交易频率
- 评估消费习惯
技术亮点
1. 灵活的分类统计
- 支持支出和收入分别统计
- 自动分配颜色
- 按金额排序
2. 直观的进度条展示
- 百分比一目了然
- 颜色编码便于识别
- 支持多分类展示
3. 完整的数据展示
- 显示金额
- 显示百分比
- 显示交易笔数
4. 简洁的交互设计
- 标签切换简单
- 无需额外操作
- 快速切换视图
欢迎加入开源鸿蒙跨平台社区:https://openharmonycrossplatform.csdn.net

AtomGit 是由开放原子开源基金会联合 CSDN 等生态伙伴共同推出的新一代开源与人工智能协作平台。平台坚持“开放、中立、公益”的理念,把代码托管、模型共享、数据集托管、智能体开发体验和算力服务整合在一起,为开发者提供从开发、训练到部署的一站式体验。
更多推荐
 12
12 0
0- 0


 已为社区贡献19条内容

所有评论(0)