Echarts怎么获取json数据
·
json代码如下
命名为city.json
{
"list":[
{
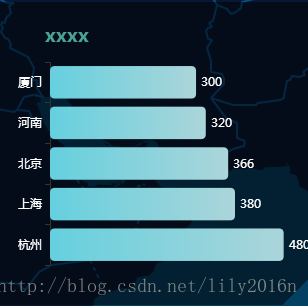
"department":"杭州",
"num":480
},
{
"department":"上海",
"num":380
},
{
"department":"北京",
"num":366
},
{
"department":"河南",
"num":320
},
{
"department":"厦门",
"num":300
}
]
}js代码
function tai(){
    var myChart = echarts.init(document.getElementById('chart'));
    option = {
        title: {
            text: 'xxxx',
            x: '40',
            textStyle:{
                color:'#4ba493',
                fontSize: 18,
                fontWeight: 'bold',
                align: 'center',
            }
        },
        tooltip : {
            trigger: 'axis',
            axisPointer : {            // 坐标轴指示器,坐标轴触发有效
                type : 'shadow'        // 默认为直线,可选为:'line' | 'shadow'
            }
        },//鼠标悬浮的效果
        grid:{
            top:40,
            x:50,
            y:45,
            bottom:40,
            borderWidth:4
              },//容器的距离
        xAxis: {
            type : 'value',
            position: 'top',
            show: false,
        },
        yAxis: {
            type : 'category',
             axisLabel: {
                show: true,
                textStyle: {
                    color: '#fff'
                }
            },
//          axisLabel : {
//                  formatter : '{b}%'
//              },
//
//          data : [ '杭州', '北京', '上海', '厦门', '成都']
            data : []
        },
        series: [
            {
                name: '实时在线台数',
                type: 'bar',
                itemStyle: {
                     emphasis: {
                        barBorderRadius: 5
                   },//设置圆角
            normal: {
//                  color: function(params) {
//                      // build a color map as your need.
//                      var colorList = ['#C1232B','#B5C334','#FCCE10','#E87C25','#27727B'];
//                              return colorList[params.dataIndex]
//                  },//设置柱状图的颜色

                   barBorderRadius: 5,//圆角
                   color: new echarts.graphic.LinearGradient(
                            0, 0, 1, 0,
                            [
                                {offset: 0, color: '#65d0de'},
                                {offset: 1, color: '#abd5da'}

                            ]
                        ),//设置柱状图渐变
                    label: {
                        show: true,
                        position: 'right',
                        formatter: '{c}',    //这是关键,在需要的地方加上就行了
                        color: '#fff',
                        }
                     }
                },
//              data: [120,210,100,40,120],
                data: [],
            }]
        };
            myChart.showLoading();    //数据加载完之前先显示一段简单的loading动画
            var namey = [];    //类别数组(实际用来盛放X轴坐标值)
            var numo = [];    //销量数组(实际用来盛放Y坐标值)
            console.log(namey)
            console.log(numo)
            $.ajax({
                type: 'get',
                url: 'json/city.json',//请求数据的地址
                dataType: "json",        //返回数据形式为json
                success: function (result) {
                    //请求成功时执行该函数内容,result即为服务器返回的json对象
                    $.each(result.list, function (index, item) {
                        namey.push(item.department);    //挨个取出类别并填入类别数组
                        numo.push(item.num);    //挨个取出销量并填入销量数组
                    });


                    myChart.hideLoading();    //隐藏加载动画
                    myChart.setOption({        //加载数据图表
                        yAxis: {
                            data: namey
                        },
                        series: [{
                            // 根据名字对应到相应的系列
                            data: numo
                        }]
                    });
                },
                error: function (errorMsg) {
                    //请求失败时执行该函数
                    alert("图表请求数据失败!");
                    myChart.hideLoading();
                }
            });
效果图如下

AtomGit 是由开放原子开源基金会联合 CSDN 等生态伙伴共同推出的新一代开源与人工智能协作平台。平台坚持“开放、中立、公益”的理念,把代码托管、模型共享、数据集托管、智能体开发体验和算力服务整合在一起,为开发者提供从开发、训练到部署的一站式体验。
更多推荐


 4
4 0
0- 0


 已为社区贡献2条内容

所有评论(0)