
Vue中实现在线画流程图实现
vue
vuejs/vue: 是一个用于构建用户界面的 JavaScript 框架,具有简洁的语法和丰富的组件库,可以用于开发单页面应用程序和多页面应用程序。
项目地址:https://gitcode.com/gh_mirrors/vu/vue
·
概述
最近在调研一些在线文档的实现,包括文档编辑器、在线思维导图、在线流程图等,前面的文章基于语雀编辑器的在线文档编辑与查看实现了文档编辑器。在本文,分享在Vue框架下基于metaeditor-mxgraph实现在线流程图。
实现效果
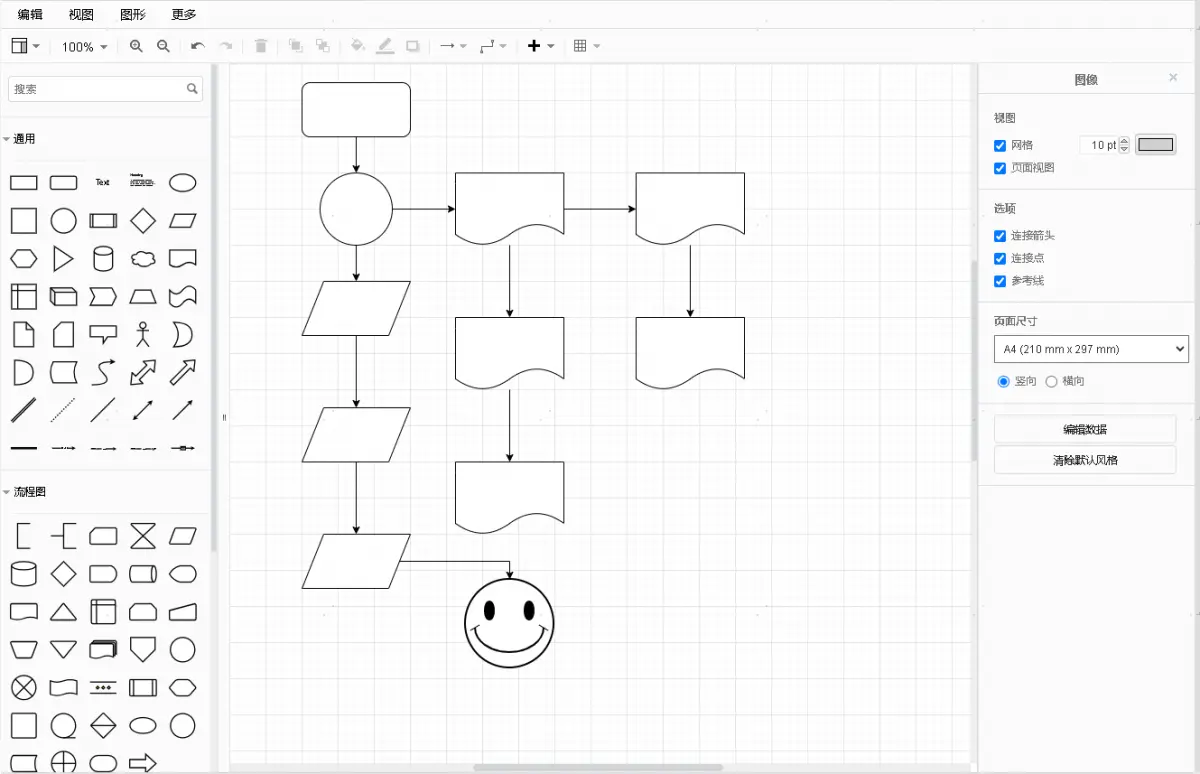
实现
1. 添加依赖
{
   "metaeditor-mxgraph": "^2.0.7"
}
2. 编辑器简介
metaeditor-mxgraph,图元编辑器,支持独立的流程图编辑器,以及 DrawIO 嵌入方案。文档地址为:https://npm.io/package/metaeditor-mxgraph。
3. 编辑器实现
<template>
  <div class="flow-chart" ref="flowChart"></div>
</template>

<script>
import 'metaeditor-mxgraph/assets/index.scss'
import { MetaEditor } from 'metaeditor-mxgraph'
const { MetaGraphEditor, getLanguage, stringToXml, xmlToString } = MetaEditor

export default {
  props: {
    chartData: {
      type: Object,
      default: () => null,
    },
  },
  mounted() {
    this.$nextTick(() => {
      this.init()
    })
  },
  watch: {
    chartData() {
      this.init()
    },
  },
  unmounted() {
    this.destroy()
  },
  methods: {
    destroy() {
      if (window.metaGraphEditor) window.metaGraphEditor.destroy()
      window.metaGraphEditor = null
    },
    init() {
      this.destroy()
      const xml = stringToXml(this.chartData || '<mxGraphModel></mxGraphModel>')
      const dom = this.$refs.flowChart
      const metaGraphEditor = new MetaGraphEditor({
        container: dom,
      })
      const lan = getLanguage('zh')
      metaGraphEditor.init(lan, xml)
      window.metaGraphEditor = metaGraphEditor
    },
  },
}
</script>

<style scoped lang="scss">
.flow-chart {
  width: 100%;
  height: 100%;
}
</style>
需要注意的是,编辑器默认是绝对定位的,想要跟随设定dom大小,需要设置其样式为:
 .metagraph-container {
    position: relative;
    width: 100%;
    height: 100%;
    user-select: none;
}
设置完样式后,菜单的位置会出错,这个还没修复,使用时请注意。
4. 文档预览
<template>
  <div class="flow-chart" ref="flowChart"></div>
</template>

<script>
import 'metaeditor-mxgraph/assets/index.scss'
import { MetaEditor } from 'metaeditor-mxgraph'
const { MetaGraphViewer, stringToXml} = MetaEditor

export default {
  props: {
    chartData: {
      type: Object,
      default: () => null,
    },
  },
  mounted() {
    this.$nextTick(() => {
      this.init()
    })
  },
  watch: {
    chartData() {
      this.init()
    },
  },
  methods: {
    init() {
      const xml = stringToXml(this.chartData || '<mxGraphModel></mxGraphModel>')
      const dom = this.$refs.flowChart
      const metaGraphEditor = new MetaGraphViewer({
        xml: xml,
      })
      const { offsetWidth, offsetHeight } = dom
      const svg = metaGraphEditor.renderSVGDom(null, 1, 1, {
        width: offsetWidth,
        height: offsetHeight,
      })
      dom.appendChild(svg)
    },
  },
}
</script>

<style scoped lang="scss">
.flow-chart {
  width: 100%;
  height: 100%;
}
</style>
vuejs/vue: 是一个用于构建用户界面的 JavaScript 框架,具有简洁的语法和丰富的组件库,可以用于开发单页面应用程序和多页面应用程序。
最近提交(Master分支:27 天前 )
9e887079
[skip ci] 11 个月前
73486cb5
* chore: fix link broken
Signed-off-by: snoppy <michaleli@foxmail.com>
* Update packages/template-compiler/README.md [skip ci]
---------
Signed-off-by: snoppy <michaleli@foxmail.com>
Co-authored-by: Eduardo San Martin Morote <posva@users.noreply.github.com> 1 年前

旨在为数千万中国开发者提供一个无缝且高效的云端环境,以支持学习、使用和贡献开源项目。
更多推荐

 4
4 0
0- 0


 已为社区贡献2条内容

所有评论(0)