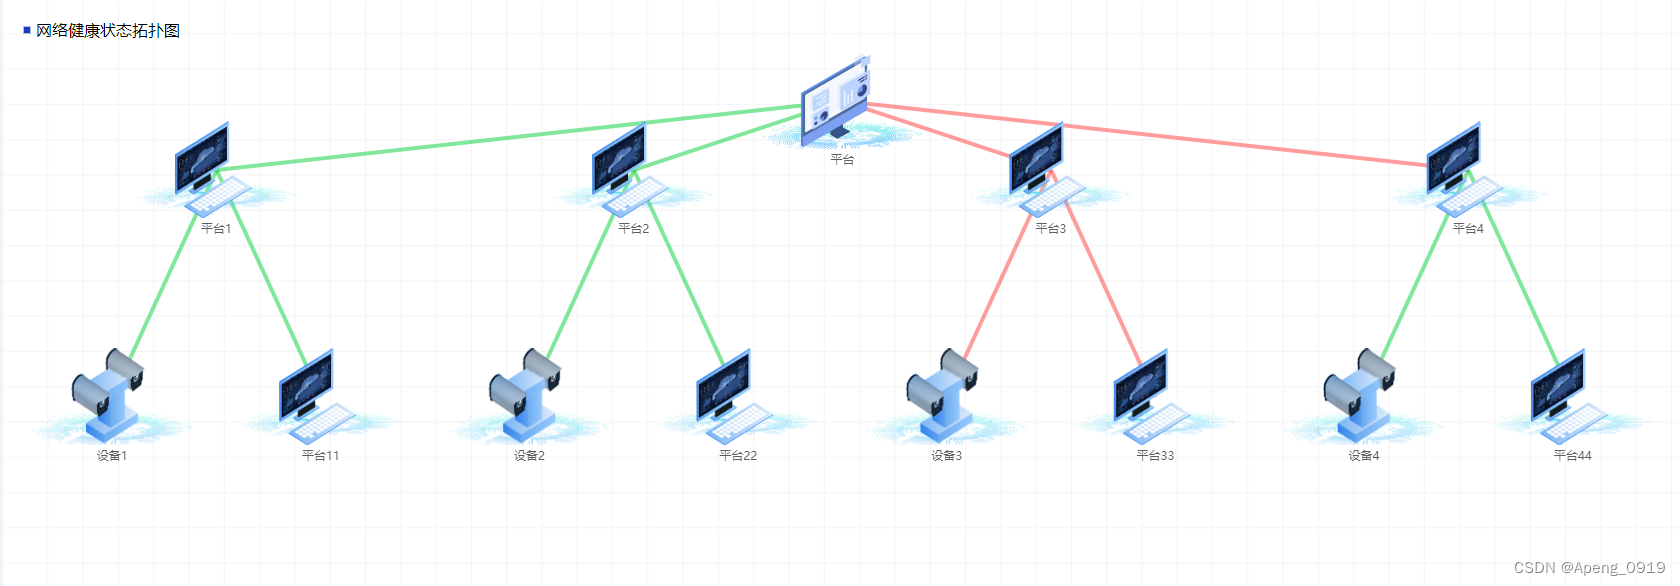
vue2 eCharts实现自定义节点图标 graph关系图
vue
vuejs/vue: 是一个用于构建用户界面的 JavaScript 框架,具有简洁的语法和丰富的组件库,可以用于开发单页面应用程序和多页面应用程序。
项目地址:https://gitcode.com/gh_mirrors/vu/vue
·
先展示最后效果图

在查阅eCharts官网的配置项手册会发现提供了自定义节点图标的方法:

代码如下,可直接复制:
(注释已标记)
 <div class="container">
    <div class="title">
      <span class="circle"></span>
      <span>网络健康状态拓扑图</span>
    </div>
    <div class="chart" ref="chart"></div>
  </div>
import * as echarts from "echarts";
import platform from "@/assets/img/vedio/platform.png"
import platform1 from "@/assets/img/vedio/platform1.png"
import device from "@/assets/img/vedio/device.png"
export default {
data() {
return {
chart: null,
chartData: [],
symbolWidth:160, //节点图片的宽度
symbolHeight:97, //节点图片的高度
linksData:[], //节点之间的连接关系
};
},
methods: {
initChart() {
let chartsData = {
nodes: [],
};
for (var j = 0; j < this.chartData.length; j++) {
const { x, y, nodeName, iconPath,name } = this.chartData[j];
var node = {
nodeName,
value: [x, y],
symbolSize: [this.symbolWidth,this.symbolHeight],
symbol: "image://" + iconPath, //自定义节点的图标
itemStyle: {
color: "orange",
},
name:name
};
chartsData.nodes.push(node);
}
this.chart = echarts.init(this.$refs.chart);
this.chart.setOption({
grid:{
left:0,
right:0,
top:0,
bottom:0
},
xAxis: {
min: 0,
max: this.$refs.chart.clientWidth,
show: false,
type: "value",
},
yAxis: {
min: 0,
max: this.$refs.chart.clientHeight,
show: false,
type: "value",
},
series: [
{
type: "graph", //指定图表类型为关系图
coordinateSystem: "cartesian2d",
label: {
show: true,
position: "bottom",
color: "#5D5D5D",
formatter: function(item) {
return item.data.nodeName;
},
},
data: chartsData.nodes, //图表数据
links: this.linksData //各个节点指向关系
},
],
});
},
setData1(arr,obj,level){
level++
if(!obj['level' + level]){
obj['level' + level] = []
}
obj['level' + level] = obj['level' + level].concat(arr)
arr.map((item)=>{
if(item.children && item.children.length != 0){
this.setData1(item.children,obj,level)
}
if(item.parentId){
let isPush = true
this.linksData.map((item1)=>{
if(item1.source === item.id && item1.target === item.parentId){
isPush = false
}
})
if(isPush){
this.linksData.push({
source: item.id, //当前节点
target: item.parentId, //连接的目标节点
lineStyle: { //连接线的样式
width: 4,
color: item.isOnLine?"#04D036":"#FF3C3C",
}
})
}
}
})
return obj
},
setData(obj,arr1,width,height){ //根据类型不同显示不同的节点图片
let keys = Object.keys(obj)
keys.map((parent,level)=>{
obj[parent].map((item,index)=>{
let iconPath;
if(item.type === 1){
iconPath = platform
}else if(item.type === 2){
iconPath = platform1
}else if(item.type === 3){
iconPath = device
}
let width1 = (width / obj[parent].length)
width1 = (width1 / 2) + index * width1
let height1 = (height / keys.length)
height1 = (height1 - this.symbolHeight) * (level + 1)
height1 = height - height1
if(level === 0){
height1 = height - this.symbolHeight
}
if(level === keys.length - 1){
height1 = 50 + this.symbolHeight
}
arr1.push({
iconPath:iconPath,
// iconPath:'',
nodeName:item.name,
x:width1,
y:height1,
name:item.id
})
})
})
return arr1
},
},
mounted() {
let data = [
{
name:"平台",
type:1,
id:"n1",
children:[
{
id:"n11",
parentId:"n1",
isOnLine:true,
name:"平台1",
type:2,
children:[
{
id:"n111",
parentId:"n11",
isOnLine:true,
name:"设备1",
type:3,
children:[]
},
{
id:"n112",
parentId:"n11",
isOnLine:true,
name:"平台11",
type:2,
children:[]
},
]
},
{
id:"n12",
parentId:"n1",
isOnLine:true,
name:"平台2",
type:2,
children:[
{
id:"n121",
parentId:"n12",
isOnLine:true,
name:"设备2",
type:3,
children:[]
},
{
id:"n122",
parentId:"n12",
isOnLine:true,
name:"平台22",
type:2,
children:[]
},
]
},
{
id:"n13",
parentId:"n1",
isOnLine:false,
name:"平台3",
type:2,
children:[
{
id:"n131",
parentId:"n13",
isOnLine:false,
name:"设备3",
type:3,
children:[]
},
{
id:"n132",
parentId:"n13",
isOnLine:false,
name:"平台33",
type:2,
children:[]
},
]
},
{
id:"n14",
parentId:"n1",
isOnLine:false,
name:"平台4",
type:2,
children:[
{
id:"n141",
parentId:"n14",
isOnLine:true,
name:"设备4",
type:3,
children:[]
},
{
id:"n142",
parentId:"n14",
isOnLine:true,
name:"平台44",
type:2,
children:[]
},
]
},
]
},
]
let chartObj = this.$refs.chart
data = this.setData1(data,{},-1)
let data1 = this.setData(data,[],chartObj.clientWidth,chartObj.clientHeight,-1)
this.chartData = data1
this.initChart();
},
};.container {
width: 100%;
height: 100%;
background: #ffffff;
border-radius: 0.06rem;
padding: 0.24rem;
position: relative;
background-image: url(~@/assets/img/vedio/background.png);
background-size: cover;
.title{
position: absolute;
top: 20px;
left: 20px;
display: flex;
align-items: center;
.circle{
width: 8px;
height: 8px;
background: #1D39C4;
border: 1px solid #B4C0DA;
margin-right: 5px;
}
}
.chart {
width: 100%;
height: 100%;
border-radius: 0.06rem;
border: 0.01rem solid #ffffff;
}
}如有问题欢迎留言!!
vuejs/vue: 是一个用于构建用户界面的 JavaScript 框架,具有简洁的语法和丰富的组件库,可以用于开发单页面应用程序和多页面应用程序。
最近提交(Master分支:2 个月前 )
73486cb5
* chore: fix link broken
Signed-off-by: snoppy <michaleli@foxmail.com>
* Update packages/template-compiler/README.md [skip ci]
---------
Signed-off-by: snoppy <michaleli@foxmail.com>
Co-authored-by: Eduardo San Martin Morote <posva@users.noreply.github.com> 4 个月前
e428d891
Updated Browser Compatibility reference. The previous currently returns HTTP 404. 5 个月前
更多推荐
 已为社区贡献6条内容


所有评论(0)