
在vue中利用highcharts+colormap+canvas实现频谱瀑布图
vue
vuejs/vue: 是一个用于构建用户界面的 JavaScript 框架,具有简洁的语法和丰富的组件库,可以用于开发单页面应用程序和多页面应用程序。
项目地址:https://gitcode.com/gh_mirrors/vu/vue
·
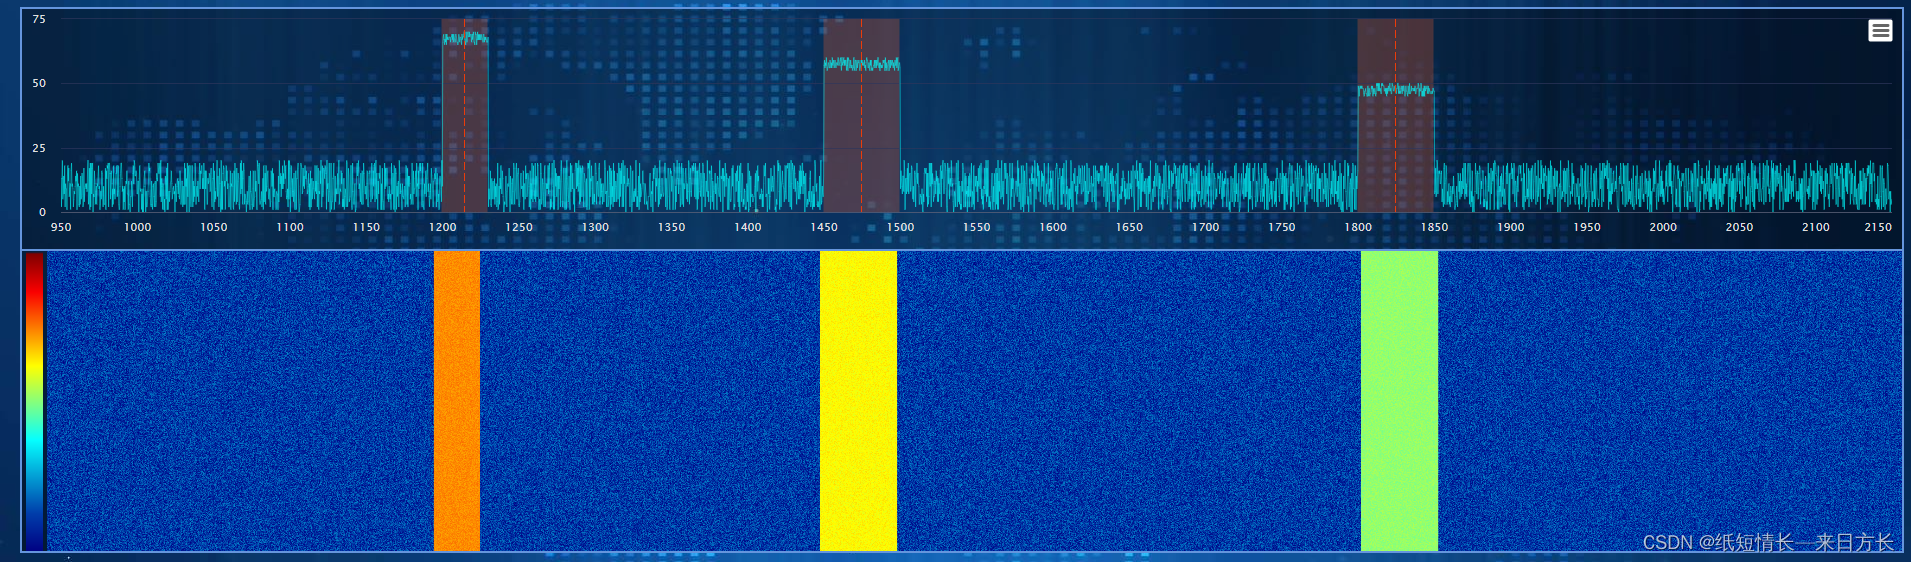
先看一下实现效果图

1.频谱图是利用highcharts编写的,因为渲染频繁问题,之前也用echarts但发现很消耗内存,所以选择了hightcharts,当前测试的用的是30ms渲染一次,基本不存在卡顿现象。
先安装需要用到的插件
npm install --save hightcharts
安装好以后在界面调用,放开发界面或者main.js都行
import Highcharts from 'highcharts';
import timeline from 'highcharts/modules/timeline';
import exporting from 'highcharts/modules/exporting';
import boost from 'highcharts/modules/boost';
timeline(Highcharts);
exporting(Highcharts);
boost(Highcharts);
然后是colormap,主要用于瀑布图对应值取色渲染
npm install --save colormap
我这边不知道是网有问题还是其他的毛病一直拉不下来,然后来了波操作,先去npm官网看colormap的版本:

在package.json中加

再拉一次
npm install
安装完毕后开始实现效果
先搭建结构
<template>
    <div>
        <div class="main">
            <!-- 频谱图 -->
            <div class="linecharts" id="linecharts"></div>
            <div class="neirong">
                <!--图例-->
                <div class="legend">
                    <canvas ref="legend"></canvas>
                </div>
                <!--瀑布图-->
                <div class="waterFall" ref="waterFallContent" @mousemove="waterFallMove($event)" @mouseleave="waterFallLeave">
                    <canvas ref="waterFall"></canvas>
                    <!--鼠标移入弹出框-->
                    <div ref="tip" class="tip"></div>
                </div>
            </div>
        </div>
    </div>
</template>
样式
<style scoped>
.main {
    width: 100vw;
    height: 100vh;
    padding: 20px;
    box-sizing: border-box;
   /*  background-image: url(../../assets/img/1.jpeg); */
    background-size: cover;
    background-repeat: no-repeat;
}
.neirong {
    width: 100%;
    height: 300px;
    display: flex;
    border: 2px solid rgb(101, 149, 221);
    background: rgba(0, 0, 0, 0.4);
    border-top: none;
}

.legend {
    width: 25px;
    height: 300px;
}

canvas {
    width: 100%;
    height: 100%;
}

.waterFall {
    width: calc(100% - 25px);
    height: 300px;
    position: relative;
}

.tip {
    pointer-events: none;
    display: none;
    background-color: #0404049e;
    border-radius: 10px;
    color: #fff;
    padding: 10px;
    box-sizing: border-box;
}
#linecharts {
    width: 100%;
    height: 240px;
    border: 2px solid rgb(101, 149, 221);
    background: rgba(0, 0, 0, 0.4);
}
</style>
频谱部分
先定义option结构,其中data数据为[[x,y],[x,y]…],如果需要详细配置的或者有点击事件的去看highcharts官网哦。
data(){
return{
  options: {
                chart: {
                    zoomType: 'x',
                    backgroundColor: 'rgba(0,0,0,0)',
                    polar: true,
                    type: 'line'
                },
                resetZoomButton: {
                    // theme: { style: { display: 'none'} }
                },
                reflow: true,
                credits: {
                    //版权
                    enabled: false
                },
                yAxis: {
                    title: {
                        enabled: false
                    },
                    gridLineColor: 'rgba(46, 54, 92, 0.69)',
                    lineColor: 'rgba(46, 54, 92, 0.69)',
                    labels: {
                        style: {
                            color: '#dfdfdf'
                        }
                    }
                },
                xAxis: {
                    labels: {
                        style: {
                            color: '#dfdfdf'
                        }
                    },
                    min: 950,
                    max: 2150,
                    showLastLabel: true,
                    gridLineColor: 'rgba(46, 54, 92, 0.69)',
                    lineColor: 'rgba(165,165,165, 0.3)',
                    showFirstLabel: true,
                    showLastLabel: true,
                    tickColor: false,
                    plotBands: [
                        {
                            from: 1200, // 标示区开始值
                            to: 1230, // 标示区结束值
                            color: 'rgba(225, 90, 47, 0.3)', // 标示区背景颜色
                            borderWidth: 0, // 标示区边框宽度
                            borderColor: '#aca', // 标示区边框颜色
                        },
                         {
                            from: 1450, // 标示区开始值
                            to: 1500, // 标示区结束值
                            color: 'rgba(225, 90, 47, 0.3)', // 标示区背景颜色
                            borderWidth: 0, // 标示区边框宽度
                            borderColor: '#aca', // 标示区边框颜色
                        },
                        {
                            from: 1800, // 标示区开始值
                            to: 1850, // 标示区结束值
                            color: 'rgba(225, 90, 47, 0.3)', // 标示区背景颜色
                            borderWidth: 0, // 标示区边框宽度
                            borderColor: '#aca', // 标示区边框颜色
                        }
                    ], //标注区
                    plotLines: [
                        {
                            color: '#EB3C0A',
                            width: 1,
                            value: 1215,
                            zIndex: 5,
                            dashStyle: 'LongDash'
                            // label:{
                            //     text:"DVB",
                            //     align:'left',
                            //     x:-34,
                            //     y:6,
                            //     style:{color:"#EB3C0A"}
                            // }
                        },
                        {
                            color: '#EB3C0A',
                            width: 1,
                            value: 1475,
                            zIndex: 5,
                            dashStyle: 'LongDash'
                        },
                        {
                            color: '#EB3C0A',
                            width: 1,
                            value: 1825,
                            zIndex: 5,
                            dashStyle: 'LongDash'
                        }
                    ]
                },
                title: {
                    enabled: false,
                    text: ''
                },
                boost: {
                    useGPUTranslations: true
                },
                legend: {
                    enabled: false
                },
                tooltip: {
                    shared: true,
                    crosshairs: true,
                    headerFormat: '111',
                    pointFormat: '222'
                },
                series: [
                    {
                        color: '#00ffff',
                        marker: {
                            enabled: false
                        },
                        animation: false,
                        enableMouseTracking: false,
                        type: 'line',
                        data: [],
                        lineWidth: 0.5
                    }
                ]
            }
}
}
然后弄模拟数据调用,这个地方主要是目前没有接通数据,所以先自己造假数据先实现效果。
 initMessage(){
       var pin=this.RandomNumBoth(40,60);
        var data=[],yData=[];
        for(var i =950;i<2150;i+=0.3){
          if(i>=1200&&i<=1230){
             let nums=this.RandomNumBoth(60,70);
            yData.push(nums)
            data.push([i,nums])
           }else if(i>=1450&&i<=1500){
             let nums=this.RandomNumBoth(50,60);
            yData.push(nums)
            data.push([i,nums])
           }else if(i>=1800&&i<=1850){
             let num1=this.RandomNumBoth(40,50);
            yData.push(num1)
            data.push([i,num1])
           }else{
              let num=this.RandomNumBoth(2,30);
                yData.push(num);
                data.push([i,num])
           }
        }
       // 折线图
        this.highInit(data);
         //瀑布图
        this.queryChartList(yData);

      },
      // 生成范围区间的值
        RandomNumBoth(Min, Max) {
            var Range = Max - Min;
            var Rand = Math.random();
            var num = Min + Math.round(Rand * Range); //四舍五入
            return num;
        },
       //频谱渲染值
        highInit(data) {
            this.options.series[0].data=data;
            Highcharts.chart('linecharts', this.options);
        },
瀑布图部分
先定义需要用到的参数
data(){
 return{
  colormap: [], //颜色库
            legend: null, //图例
            waterFall: null, //瀑布图
            waterFallList: [], //瀑布图源数据
            waterFallIndex: 0, //瀑布图定时器用到的计数标识
            waterFallCopyList: [], //瀑布图二维数组(用来显示数据做的临时储存)
            timer: null, //瀑布图定时器
            waterFallWidth: 0, //瀑布图的宽度(后端返回的数据length)
            waterFallHeight: 0, //瀑布图定高度(也可以理解成渲染次数 例如30次渲染完成)
            maxNum: 80, //图例最大值
            minNum: 0, //图例最小值
    }
 }
methods部分
  // 创建颜色库
        setColormap() {
            let that = this;
            let colormap = require('colormap');
            that.colormap = colormap({
                colormap: 'jet',//jet,cool,winter
                nshades: 150,
                format: 'rba',
                alpha: 1
            });
        },
        // 创建图例
        createLegendCanvas() {
            let that = this;
            let legendRefs = that.$refs.legend;
            that.legend = legendRefs.getContext('2d');
            let legendCanvas = document.createElement('canvas');
            legendCanvas.width = 1;
            let legendCanvasTemporary = legendCanvas.getContext('2d');
            const imageData = legendCanvasTemporary.createImageData(1, that.colormap.length);
            for (let i = 0; i < that.colormap.length; i++) {
                const color = that.colormap[i];
                imageData.data[imageData.data.length - i * 4 + 0] = color[0];
                imageData.data[imageData.data.length - i * 4 + 1] = color[1];
                imageData.data[imageData.data.length - i * 4 + 2] = color[2];
                imageData.data[imageData.data.length - i * 4 + 3] = 255;
            }
            legendCanvasTemporary.putImageData(imageData, 0, 0);
            that.legend.drawImage(legendCanvasTemporary.canvas, 0, 0, 1, that.colormap.length, 50, 0, 200, that.legend.canvas.height);
        },
        // 创建瀑布图
        createWaterFallCanvas() {
            let that = this;
            let waterFall = that.$refs.waterFall;
            that.waterFall = waterFall.getContext('2d');
            waterFall.width = that.waterFallWidth;
            waterFall.height = that.$refs.waterFallContent.offsetHeight;
        },
        // 绘制单行图像
        rowToImageData(data) {
            let that = this;
            if (that.$refs.waterFallContent !== undefined) {
                let canvasHeight = Math.floor(that.$refs.waterFallContent.offsetHeight / that.waterFallHeight);
                let imgOld = that.waterFall.getImageData(0, 0, that.waterFallWidth, canvasHeight * that.waterFallIndex + 1);
                const imageData = that.waterFall.createImageData(data.length, 1);
                for (let i = 0; i < imageData.data.length; i += 4) {
                    const cindex = that.colorMapData(data[i / 4], 0, 130);
                    const color = that.colormap[cindex];
                    imageData.data[i + 0] = color[0];
                    imageData.data[i + 1] = color[1];
                    imageData.data[i + 2] = color[2];
                    imageData.data[i + 3] = 255;
                }
                for (let i = 0; i < canvasHeight; i++) {
                    that.waterFall.putImageData(imageData, 0, i);
                }
                that.waterFall.putImageData(imgOld, 0, canvasHeight);
            }
        },
        // 还回对应的颜色
        colorMapData(data, outMin, outMax) {
            let that = this;
            if (data <= that.minNum) {
                return outMin;
            } else if (data >= that.maxNum) {
                return outMax;
            }
            return Math.round(((data - that.minNum) / (that.maxNum - that.minNum)) * outMax);
        },

 queryChartList(data) {
            let that = this;
            that.waterFallWidth = data.length;
            that.waterFallHeight = 300;
            if (that.waterFall === null) {
                that.createWaterFallCanvas(data.length);
            }
            that.rowToImageData(data);
            that.waterFallCopyList.unshift(data);
            that.waterFallIndex++;
            if (that.waterFallIndex > that.waterFallHeight) {
                that.waterFallCopyList.pop();
            }
        }
然后写个计时器去调用,别忘了销毁它
 mounted() {
        let that = this;
        that.setColormap();
        that.createLegendCanvas();

        // 模拟假数据
        this.timer=setInterval(()=>{
            this.initMessage();
        },30)

    },
    destroyed() {
        let that = this;
        clearInterval(that.timer);
    },
这样就大功告成啦!!! 如果帮助到你记得点赞加收藏哦!!!!!
我还在这个基础上封装了,用的是echarts,优化代码,请看我宁外一篇文章在vue中利用echarts+colormap+canvas实现频谱瀑布图
vuejs/vue: 是一个用于构建用户界面的 JavaScript 框架,具有简洁的语法和丰富的组件库,可以用于开发单页面应用程序和多页面应用程序。
最近提交(Master分支:1 个月前 )
73486cb5
* chore: fix link broken
Signed-off-by: snoppy <michaleli@foxmail.com>
* Update packages/template-compiler/README.md [skip ci]
---------
Signed-off-by: snoppy <michaleli@foxmail.com>
Co-authored-by: Eduardo San Martin Morote <posva@users.noreply.github.com> 3 个月前
e428d891
Updated Browser Compatibility reference. The previous currently returns HTTP 404. 3 个月前

旨在为数千万中国开发者提供一个无缝且高效的云端环境,以支持学习、使用和贡献开源项目。
更多推荐
 12
12 0
0- 0


 已为社区贡献3条内容

所有评论(0)