
Leaflet基础:GeoJSON和leaflet配合使用(二)
json
适用于现代 C++ 的 JSON。
项目地址:https://gitcode.com/gh_mirrors/js/json
·
一、概念
1. GeoJSON 是许多 GIS 技术和服务中非常流行的数据格式,它简单、轻量级、直接,而且 Leaflet 非常擅长处理它。
2. GeoJSON 对象可以表示空间区域 (Geometry)、空间边界实体 (Feature) 或要素列表 (FeatureCollection) 。
3.GeoJSON 支持以下几何类型:( Features 和 FeatureCollections 效果最佳)
- Point
- LineString
- Polygon
- MultiPoint
- MultiLineString
- MultiPolygon
- GeometryCollection。
二、GeoJSON 层:下面是一个简单的 GeoJSON 功能示例:
注意:L.map中设置经纬度是:【维度,经度】
注意:geoJSON中设置的经纬度是:【经度、维度】
var geojsonFeature = [
  {
    type: "Feature",
    properties: {
      name: "GeoJSON 点一",
      show_on_map: true, // 滤波器:控制可见性
      amenity: "Baseball Stadium",
      popupContent: "我是GeoJSON中点的点击事件回显字段:popupContent!",
    },
    geometry: {
      type: "Point",
      coordinates: [116.724762, 39.904896],
    },
  },
];
/**
 * @author:南希Libra
 * @description:初始化地图
 */
const initMap = () => {
  var map = L.map("geoJson").setView([39.904896, 116.724762], 11);
  //GeoJSON 一个点
  L.geoJSON(geojsonFeature, {
  }).addTo(map);
  let url =
    "http://webrd01.is.autonavi.com/appmaptile?lang=zh_cn&size=1&scale=1&style=7&x={x}&y={y}&z={z}";
  // let url='https://{s}.tile.openstreetmap.org/{z}/{x}/{y}.png'
  L.tileLayer(url, {
    maxZoom: 16,
  }).addTo(map);
};
三:风格:也就是样式

1. 点的样式处理(pointToLayer)
var geojsonMarkerOptions = {
  radius: 8,
  fillColor: "#ff7800",
  color: "#000",
  weight: 1,
  opacity: 1,
  fillOpacity: 0.8,
};
// 下面的代码放在initMap方法内
  L.geoJSON(geojsonFeature, {
    // 修改样式
    pointToLayer: function (feature, latlng) {
      return L.circleMarker(latlng, geojsonMarkerOptions);
    },

  }).addTo(map);
2. 线段和面(多变形)的样式处理(style)
// 在上面的基础上编辑
// 这是线段
var draw_line = {
  type: "Feature",
  geometry: {
    type: "LineString",
    coordinates: [
      [116.724762, 39.904896],
      [116.397469, 39.908821],
    ],
  },
  properties: {
    popupContent: "我是GeoJSON中线段的点击事件回显字段:popupContent.",
    underConstruction: true,
  },
};
// 这是多边形
var states = [
  {
    type: "Feature",
    properties: { party: "Republican" },
    geometry: {
      type: "Polygon",
      coordinates: [
        [
          [116.393822, 39.90517],
          [116.389803, 39.90466],
          [116.397142, 39.91747],
          [116.404867, 39.91312],
          [116.393822, 39.90517],
        ],
      ],
    },
  },
  {
    type: "Feature",
    properties: { party: "Democrat" },
    geometry: {
      type: "Polygon",
      coordinates: [
        [
          [116.724762, 39.904896],
          [116.718449, 39.913126],
          [116.729435, 39.916089],
          [116.738922, 39.910493],
          [116.724762, 39.904896],
        ],
      ],
    },
  },
];

// 下面代码放在initMap方法内
  L.geoJson(draw_line, {
    style: {
      color: "red",
      weight: 5,
    },
    onEachFeature,
  }).addTo(map);
  //GeoJSON 多边形
  L.geoJSON(states, {
    style: function (feature) {
      switch (feature.properties.party) {
        case "Republican":
          return { color: "#ff0000" };
        case "Democrat":
          return { color: "#0000ff" };
      }
    },
  }).addTo(map);
四、点击事件:onEachFeature

/**
 * @author:南希Libra
 * @description:类似于点击事件方法
 */
const onEachFeature = (feature, layer) => {
  if (feature.properties && feature.properties.popupContent) {
    layer.bindPopup(feature.properties.popupContent);
  }
};
// 下面代码放在initMap方法中
  L.geoJSON(geojsonFeature, {
    // 点击事件
    onEachFeature: onEachFeature,
  }).addTo(map);
五、滤波器(filter)
主要操作就是:在properties对象中添加:show_on_map:true或者false,然后在L.geoJSON中使用过滤器
var geojsonFeature = [
{
type: "Feature",
properties: {
name: "GeoJSON 点一",
show_on_map: true, // 滤波器:控制可见性
},
...
},
{
type: "Feature",
properties: {
name: "GeoJSON 点二",
show_on_map: false, // 滤波器:控制可见性
},
...
},
];
// 下面代码放在initMap方法内
L.geoJSON(geojsonFeature, {
filter: function (feature, layer) {
return feature.properties.show_on_map;
},
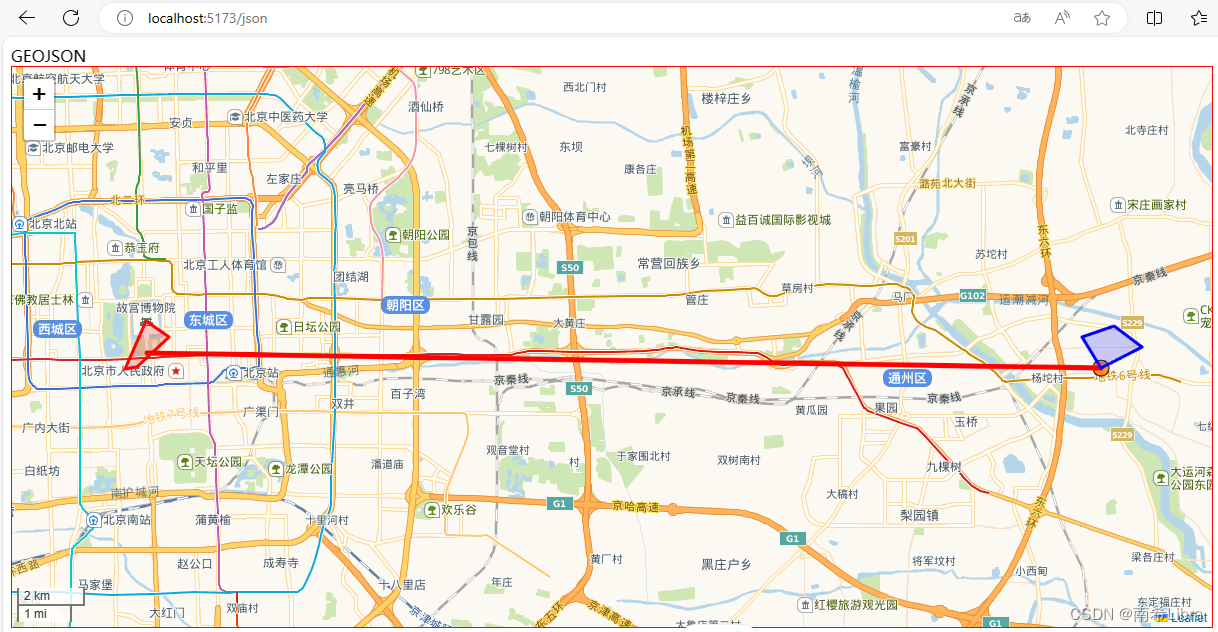
}).addTo(map);六、整体全部代码(效果如封面)
<script setup>
import L from "leaflet";
import "leaflet/dist/leaflet.css";
import { onMounted } from "vue";
var geojsonFeature = [
  {
    type: "Feature",
    properties: {
      name: "GeoJSON 点一",
      show_on_map: true, // 滤波器:控制可见性
      amenity: "Baseball Stadium",
      popupContent: "我是GeoJSON中点的点击事件回显字段:popupContent!",
    },
    geometry: {
      type: "Point",
      coordinates: [116.724762, 39.904896],
    },
  },
  {
    type: "Feature",
    properties: {
      name: "GeoJSON 点二",
      show_on_map: false, // 滤波器:控制可见性
      amenity: "Baseball Stadium",
      popupContent: "我是GeoJSON中点的点击事件回显字段:popupContent!",
    },
    geometry: {
      type: "Point",
      coordinates: [116.397469, 39.908821],
    },
  },
];
var geojsonMarkerOptions = {
  radius: 8,
  fillColor: "#ff7800",
  color: "#000",
  weight: 1,
  opacity: 1,
  fillOpacity: 0.8,
};
var draw_line = {
  type: "Feature",
  geometry: {
    type: "LineString",
    coordinates: [
      [116.724762, 39.904896],
      [116.397469, 39.908821],
    ],
  },
  properties: {
    popupContent: "我是GeoJSON中线段的点击事件回显字段:popupContent.",
    underConstruction: true,
  },
  id: 2,
};
var states = [
  {
    type: "Feature",
    properties: { party: "Republican" },
    geometry: {
      type: "Polygon",
      coordinates: [
        [
          [116.393822, 39.90517],
          [116.389803, 39.90466],
          [116.397142, 39.91747],
          [116.404867, 39.91312],
          [116.393822, 39.90517],
        ],
      ],
    },
  },
  {
    type: "Feature",
    properties: { party: "Democrat" },
    geometry: {
      type: "Polygon",
      coordinates: [
        [
          [116.724762, 39.904896],
          [116.718449, 39.913126],
          [116.729435, 39.916089],
          [116.738922, 39.910493],
          [116.724762, 39.904896],
        ],
      ],
    },
  },
];

onMounted(() => {
  initMap();
});

/**
 * @author:南希Libra
 * @description:初始化地图
 */
const initMap = () => {
  var map = L.map("geoJson").setView([39.904896, 116.724762], 11);
  //GeoJSON 一个点
  L.geoJSON(geojsonFeature, {
    // 修改样式
    pointToLayer: function (feature, latlng) {
      return L.circleMarker(latlng, geojsonMarkerOptions);
    },
    // 点击事件
    onEachFeature: onEachFeature,
     滤波器:控制可见性
    filter: function (feature, layer) {
      return feature.properties.show_on_map;
    },
  }).addTo(map);
  //GeoJSON 线段
  L.geoJson(draw_line, {
    style: {
      color: "red",
      weight: 5,
    },
    onEachFeature,
  }).addTo(map);
  //GeoJSON 多边形
  L.geoJSON(states, {
    style: function (feature) {
      switch (feature.properties.party) {
        case "Republican":
          return { color: "#ff0000" };
        case "Democrat":
          return { color: "#0000ff" };
      }
    },
  }).addTo(map);
  let url =
    "http://webrd01.is.autonavi.com/appmaptile?lang=zh_cn&size=1&scale=1&style=7&x={x}&y={y}&z={z}";
  // let url='https://{s}.tile.openstreetmap.org/{z}/{x}/{y}.png'
  L.tileLayer(url, {
    maxZoom: 16,
  }).addTo(map);
  // 显示应用于地图中心点的比例
  L.control.scale().addTo(map);
};

/**
 * @author:南希Libra
 * @description:类似于点击事件方法
 */
const onEachFeature = (feature, layer) => {
  if (feature.properties && feature.properties.popupContent) {
    layer.bindPopup(feature.properties.popupContent);
  }
};


</script>

<template name='GeoJSON'>
  <div id="geoJson"></div>
</template>

<style scoped lang='scss'>
#geoJson {
  width: 1200px;
  height: 560px;
  border: 1px solid #f00;
}
</style>
学习文档:
1. 获取经纬度网址:https://map.jiqrxx.com/jingweidu/
2. 学习文档:https://leafletjs.com/examples/geojson/
3.GeoJSON各字段定义的属性含义:https://leafletjs.com/reference.html#geojson
4.https://malagis.com/leaflet-chinese-api-document-v1-9-geojson.html
适用于现代 C++ 的 JSON。
最近提交(Master分支:1 个月前 )
960b763e
2 个月前
8c391e04
5 个月前

旨在为数千万中国开发者提供一个无缝且高效的云端环境,以支持学习、使用和贡献开源项目。
更多推荐
 3
3 0
0- 0


 已为社区贡献1条内容

所有评论(0)