vue中使用echarts绘制仪表盘
vue
vuejs/vue: 是一个用于构建用户界面的 JavaScript 框架,具有简洁的语法和丰富的组件库,可以用于开发单页面应用程序和多页面应用程序。
项目地址:https://gitcode.com/gh_mirrors/vu/vue
·
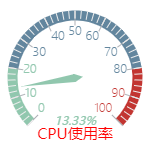
效果图
目录
一、安装echarts
1、控制台使用命令进行安装
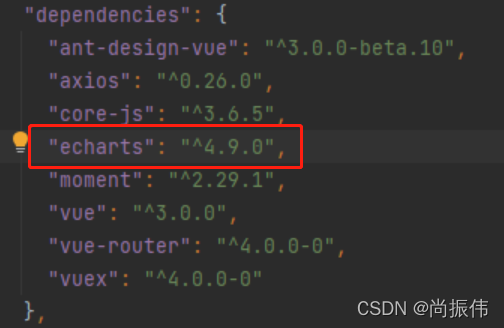
npm install echarts --save2、在package.json中配置echarts
3、在main.js中引用
import echarts from 'echarts'

Vue.use(echarts)
二、vue中使用echarts
1、首先设置一个放置图标的dom节点
<template #extra>
     <div ref="chart" style="width: 180px; height: 180px"></div>
     <!-- <div id="chart" style="width: 200px; height: 200px"></div>-->
</template>
两种方式ref和id
2、在.vue文件的<script>标签中引入echarts
let echarts = require("echarts")3、绘制仪表盘的方法
    drawMyChart() {
      let myChart = echarts.init(this.$refs.chart);
      // var myChart = echarts.init(document.getElementById("chart"));
      // 绘制图表
      myChart.setOption({
        tooltip: {
          formatter: "{a} <br/>{b} : {c}%",
        },
        toolbox: {
          show: false,
          feature: {
            restore: {},
            saveAsImage: {},
          },
        },
        // 配置
        series: [
          {
            name: "CPU使用率",
            type: "gauge",
            axisLabel: {distance: 0, fontWeight: 100, shadowOffsetY: 100, height: 100},
            axisLine: {
              lineStyle: {
                width: 10 // 修改仪表盘宽度的属性
              }
            },
            splitLine: {//分隔线样式相关
              length: 15,//分割线的长度
              lineStyle: {
                width: 1,
                color: '#b0b3b8'
              }
            },
            title: {offsetCenter: [0, '85%'], color: 'red'},
            detail: {formatter: "{value}%", offsetCenter: [0, '65%'], fontStyle: "oblique", fontSize: 12},
            pointer: {width: 4},
            data: [{value: 13.33, name: "CPU使用率"}]
          },
        ],
      });
    },
4、在vue中需要用到的地方调用绘制图标的方法
mounted() {
    this.drawMyChart();
},
vuejs/vue: 是一个用于构建用户界面的 JavaScript 框架,具有简洁的语法和丰富的组件库,可以用于开发单页面应用程序和多页面应用程序。
最近提交(Master分支:2 个月前 )
9e887079
[skip ci] 1 年前
73486cb5
* chore: fix link broken
Signed-off-by: snoppy <michaleli@foxmail.com>
* Update packages/template-compiler/README.md [skip ci]
---------
Signed-off-by: snoppy <michaleli@foxmail.com>
Co-authored-by: Eduardo San Martin Morote <posva@users.noreply.github.com> 1 年前

AtomGit 是由开放原子开源基金会联合 CSDN 等生态伙伴共同推出的新一代开源与人工智能协作平台。平台坚持“开放、中立、公益”的理念,把代码托管、模型共享、数据集托管、智能体开发体验和算力服务整合在一起,为开发者提供从开发、训练到部署的一站式体验。
更多推荐


 1
1 0
0- 0


 已为社区贡献1条内容

所有评论(0)