vue实现echarts甘特图
vue
vuejs/vue: 是一个用于构建用户界面的 JavaScript 框架,具有简洁的语法和丰富的组件库,可以用于开发单页面应用程序和多页面应用程序。
项目地址:https://gitcode.com/gh_mirrors/vu/vue
·
使用场景
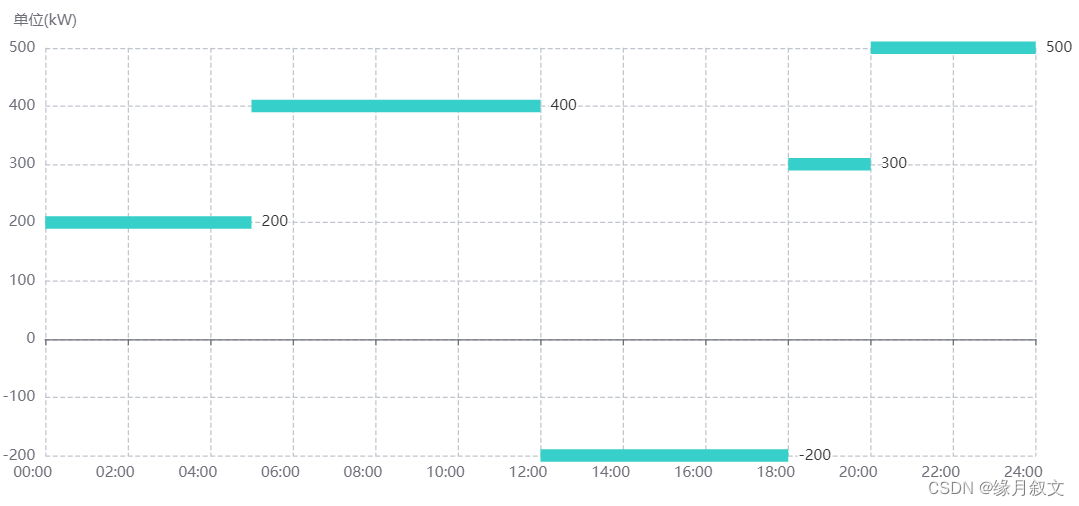
主要用于横坐标固定,比如一天24小时,这样就可以根据Y轴数据可正可负
速用示例版
可以直接将option 复制即可
option = {
  tooltip: {
    trigger: 'axis'
  },
   grid: {
    top: '10%',
    left: '3%',
    right: '4%',
    bottom: '3%',
    containLabel: true
  },
  toolbox: {
    show: true,
    feature: {
      saveAsImage: {}
    }
  },
  xAxis: {
    type: 'category',
    boundaryGap: false,
    splitLine: {
      show: true
    },
    axisLabel: {
      padding: [0, 0, 0, -20]    // 四个数字分别为上右下左与原位置距离
    },
    data: ['00:00', '01:00', '02:00', '03:00', '04:00', '05:00', '06:00','07:00', '08:00', '09:00', '10:00', '11:00', '12:00', '13:00', '14:00', '15:00', '16:00', '17:00', '18:00', '19:00', '20:00', '21:00', '22:00', '23:00', '24:00']
  },
  yAxis: {
    type: 'value',
    name: '单位(kW)',
    // scale: true,
    splitLine: {
      show: false
    },
    axisLabel: {
      formatter: '{value}',

    }
  },
  series: [
    {
      name: '',
      type: 'line',
      smooth: true,
      showSymbol: false,
      symbol: false,
      lineStyle: {
        normal: {
          width: 10
        }
      },
      markPoint: {
        data: [
          {
            name: '最大值',
            type: 'max',
            valueIndex: 0
          }
        ]
      },
      data: [300, 300, 300, 300, 300, 300, 300],
    },
    {
      name: '',
      type: 'line',
      smooth: true,
      showSymbol: false,
      symbol: false,
      lineStyle: {
        width: 10
      },
      markPoint: {
        data: [
          {
            name: '最大值',
            type: 'max',
            valueIndex: 0
          }
        ]
      },
      data: ['','','','','','', 500, 500, 500, 500, 500]
    },
    {
      name: '',
      type: 'line',
      smooth: true,
      showSymbol: false,
      symbol: false,
      lineStyle: {
        normal: {
          width: 10
        }
      },
      markPoint: {
        data: [
          {
            name: '最大值',
            type: 'max',
            valueIndex: 0
          }
        ]
      },
      data: ['','','','','','','', '', '','',-100, -100,-100, -100,-100]
    },
    {
      name: '',
      type: 'line',
      smooth: true,
      showSymbol: false,
      symbol: false,
      lineStyle: {
        normal: {
          width: 10
        }
      },
      markPoint: {
        data: [
          {
            name: '最大值',
            type: 'max',
            valueIndex: 0
          }
        ]
      },
      data: ['','','','','','','', '', '','','','','','','',200,200,200,200,200,200,200,200,200,200]
    }
  ]
};

来源:前端~初学者
业务需求比较相似,而且时间紧张,幸得此文
润雨细无声版
<div ref="strategyDomRef"
 style="width: 800px;
        height: 600px;"
>
import * as echarts from 'echarts'
data(){
	return{
		yAxis:[]
	}
},
mounted() {
 let apiData = [
      {
        startTime: '00:00',
        endTime: '05:00',
        value: 200,
      },
      {
        startTime: '05:00',
        endTime: '12:00',
        value: 400,
      },
      {
        startTime: '12:00',
        endTime: '18:00',
        value: -200,
      },
      {
        startTime: '18:00',
        endTime: '20:00',
        value: 300,
      },
      {
        startTime: '20:00',
        endTime: '24:00',
        value: 500,
      },
    ]
    this.dealArr(apiData)
	this.echartsDraw()
},
methods:{
	//数据处理
	dealArr(apiData) {
      let YAxis = []
      apiData.forEach((element) => {
      let dealArr = new Array(
        element.endTime == '24:00' ? 25 : parseInt(element.endTime) + 1
      ).fill(Number(element.value))
      let yItem = {
        name: ' ',
        type: 'line',
        showSymbol: false,
        endLabel: {
          show: true,
          formatter: '{c}',
          position: 'start',
          fontSize: 12,
        },
        lineStyle: {
          width: 10,
          color: '#36CFC9',
        },
        data: dealArr.fill('', 0, parseInt(element.startTime)),
      }
      YAxis.push(yItem)
    })
    this.yAxis = YAxis
    },
    //图表绘制
	echartsDraw(){
	 let charts = echarts.init(this.$refs.strategyDomRef)
            let option = {
        tooltip: {
          trigger: 'axis',
          formatter: function (params) {
            return '<br/> 功率 : ' + params[0].value
          },
        },
        grid: {
          top: '10%',
          left: '3%',
          right: '4%',
          bottom: '3%',
          containLabel: true,
        },
        xAxis: {
          type: 'category',
          boundaryGap: false,
          splitLine: {
            // 网格线
            show: true,
            lineStyle: {
              //分割线
              color: '#C0C4CC',
              width: 1,
              type: 'dashed', //dotted:虚线 solid:实线
            },
          },
          axisLabel: {
            padding: [0, 0, 0, -20], // 四个数字分别为上右下左与原位置距离
          },
          data: [
            '00:00',
            '01:00',
            '02:00',
            '03:00',
            '04:00',
            '05:00',
            '06:00',
            '07:00',
            '08:00',
            '09:00',
            '10:00',
            '11:00',
            '12:00',
            '13:00',
            '14:00',
            '15:00',
            '16:00',
            '17:00',
            '18:00',
            '19:00',
            '20:00',
            '21:00',
            '22:00',
            '23:00',
            '24:00',
          ],
        },
        yAxis: {
          type: 'value',
          name: '单位(kW)',
          splitLine: {
            // 网格线
            show: true,
            lineStyle: {
              //分割线
              color: '#C0C4CC',
              width: 1,
              type: 'dashed', //dotted:虚线 solid:实线
            },
          },
          axisLabel: {
            formatter: '{value}',
          },
        },
        series: this.yAxis,
      }
      charts.setOption(option, true)
      //清空画布,防止缓存
      charts.clear()
      //使用刚指定的配置项和数据显示图表。
      charts.setOption(option, true)
      window.addEventListener('resize', function () {
        charts.resize()
      })
	}
}
效果图

x时间轴非整点版
完成代码:
<template>
  <div ref="strategyDomRef"
       style="width: 1000px;
        height: 400px;">
  </div>
</template>

<script>
import * as echarts from 'echarts'
export default {
  data() {
    return {
      yAxis: [],
      xAxis: [
        '00:00',
        '01:00',
        '02:00',
        '03:00',
        '04:00',
        '05:00',
        '06:00',
        '07:00',
        '08:00',
        '09:00',
        '10:00',
        '11:00',
        '12:00',
        '13:00',
        '14:00',
        '15:00',
        '16:00',
        '17:00',
        '18:00',
        '19:00',
        '20:00',
        '21:00',
        '22:00',
        '23:00',
        '24:00',
      ],
    }
  },
  mounted() {
    let apiData = [
      {
        startTime: '00:00',
        endTime: '05:52',
        value: 200,
      },
      {
        startTime: '05:52',
        endTime: '12:01',
        value: 400,
      },
      {
        startTime: '12:01',
        endTime: '18:00',
        value: -200,
      },
      {
        startTime: '18:00',
        endTime: '20:12',
        value: 300,
      },
      {
        startTime: '20:12',
        endTime: '24:00',
        value: 500,
      },
    ]
    this.dealArr(apiData)
    this.echartsDraw()
  },
  methods: {
    //数据处理
    dealArr(apiData) {
      // 将非整点数据追加到x轴数据中去
      apiData.forEach((element1, index) => {
        if (index > 0) {
          const checkIndex = this.xAxis.findIndex((element2) => {
            return parseInt(element1.startTime) === parseInt(element2)
          })
          this.xAxis.splice(checkIndex + 1, 0, element1.startTime)
        }
      })
      let oldIndex = 0
      let newIndex = 0
      apiData.forEach((item3) => {
        const checkIndex2 = this.xAxis.findIndex((element4) => {
          return item3.endTime === element4
        })
        newIndex = checkIndex2
        // 先将Y轴数据按照时间顺序添加数据
        let arr1 = new Array(newIndex + 1).fill(Number(item3.value))
        let yItem = {
          name: ' ',
          type: 'line',
          showSymbol: false,
          endLabel: {
            show: true,
            formatter: '{c}',
            position: 'start',
            fontSize: 12,
          },
          lineStyle: {
            width: 10,
            color: '#36CFC9',
          },
          // 再将startTime时间之前的数据设置成‘’
          data: arr1.fill('', 0, oldIndex),
        }
        this.yAxis.push(yItem)
        const temp = newIndex
        oldIndex = temp
      })
    },
    //图表绘制
    echartsDraw() {
      let charts = echarts.init(this.$refs.strategyDomRef)
      let option = {
        tooltip: {
          trigger: 'axis',
          formatter: function (params) {
            return params[0].axisValue + '<br/> 功率 : ' + params[0].value
          },
        },
        grid: {
          top: '10%',
          left: '3%',
          right: '4%',
          bottom: '3%',
          containLabel: true,
        },
        xAxis: {
          type: 'category',
          boundaryGap: false,
          splitLine: {
            // 网格线
            show: true,
            lineStyle: {
              //分割线
              color: '#C0C4CC',
              width: 1,
              type: 'dashed', //dotted:虚线 solid:实线
            },
          },
          axisLabel: {
            padding: [0, 0, 0, -20], // 四个数字分别为上右下左与原位置距离
          },
          data: this.xAxis,
        },
        yAxis: {
          type: 'value',
          name: '单位(kW)',
          splitLine: {
            // 网格线
            show: true,
            lineStyle: {
              //分割线
              color: '#C0C4CC',
              width: 1,
              type: 'dashed', //dotted:虚线 solid:实线
            },
          },
          axisLabel: {
            formatter: '{value}',
          },
        },
        series: this.yAxis,
      }
      charts.setOption(option, true)
      //清空画布,防止缓存
      charts.clear()
      //使用刚指定的配置项和数据显示图表。
      charts.setOption(option, true)
      window.addEventListener('resize', function () {
        charts.resize()
      })
    },
  },
}
</script>

vuejs/vue: 是一个用于构建用户界面的 JavaScript 框架,具有简洁的语法和丰富的组件库,可以用于开发单页面应用程序和多页面应用程序。
最近提交(Master分支:2 个月前 )
73486cb5
* chore: fix link broken
Signed-off-by: snoppy <michaleli@foxmail.com>
* Update packages/template-compiler/README.md [skip ci]
---------
Signed-off-by: snoppy <michaleli@foxmail.com>
Co-authored-by: Eduardo San Martin Morote <posva@users.noreply.github.com> 4 个月前
e428d891
Updated Browser Compatibility reference. The previous currently returns HTTP 404. 5 个月前
更多推荐
 已为社区贡献3条内容


所有评论(0)