vue使用openlayers实现流动线
vue
vuejs/vue: 是一个用于构建用户界面的 JavaScript 框架,具有简洁的语法和丰富的组件库,可以用于开发单页面应用程序和多页面应用程序。
项目地址:https://gitcode.com/gh_mirrors/vu/vue
·
需求:使用vue3+openlayers绘制流动线,效果如下
主要代码:语法为vue3+ts+openlayers
<template>
  <div class="MapContainer" ref="mapContainer"></div>
  <!-- 弹窗 -->
  <div ref="pointDom" class="popup-content"></div>
</template>
<script setup lang="ts">
import { onMounted, ref } from "vue";
import "ol/ol.css";
import initMap from "@/utils/map/InitMap";
import { Feature, Map, Overlay } from "ol";
import {
  MultiPolygon,
  Polygon,
  MultiLineString,
  LineString,
  Point,
Geometry,
} from "ol/geom";
import { Style, Fill, Stroke, Circle, Icon } from "ol/style";
import VectorLayer from "ol/layer/Vector";
import { Vector as VectorSource } from "ol/source";
import { featuresJson } from "@/utils/mock/lineMock";

const mapContainer = ref();
let myMap: Map;
let json = featuresJson;
function getGeojson() {
  console.log("aaaaaaa", json);
  const featuresJson = json.data.features;
  const source = new VectorSource();
  // 设置图层
  const routeLayer = new VectorLayer({
    source,
  });
  featuresJson.forEach((g) => {
    let lineData:any = g.geometry;
    let routeFeature: Feature<Geometry>;
    if (lineData.type === "MultiPolygon") {
      routeFeature = new Feature({
        geometry: new MultiPolygon(lineData.coordinates),
      });
      routeFeature.setStyle(
        new Style({
          fill: new Fill({
            color: "rgba(127,255,170)", //填充颜色
          }),
          stroke: new Stroke({
            width: 2, //边界宽度
            color: [35, 160, 72, 1], //边界颜色
          }),
        })
      );
    } else if (lineData.type === "Polygon") {
      routeFeature = new Feature({
        geometry: new Polygon(lineData.coordinates),
      });
      routeFeature.setStyle(
        new Style({
          fill: new Fill({
            color: "rgba(35, 160, 72, 1)", //填充颜色
          }),
          stroke: new Stroke({
            width: 2, //边界宽度
            color: [35, 160, 72, 1], //边界颜色
          }),
        })
      );
    // 多条线段
    } else if (lineData.type === "MultiLineString") {
      // console.log("线====", lineData, lineData.coordinates);
      routeFeature = new Feature({
        geometry: new MultiLineString(lineData.coordinates),
      });
      let offset = 0;
      setInterval(() => {
          offset -= 1;
          routeFeature.setStyle(LineStyleFunction(offset))
      }, 200)
    } else if (lineData.type === "LineString") {
      routeFeature = new Feature({
        geometry: new LineString(lineData.coordinates),
      });
      routeFeature.setStyle(
        new Style({
          fill: new Fill({
            color: "rgba(35, 160, 72, 1)", //填充颜色
          }),
          stroke: new Stroke({
            width: 2, //边界宽度
            color: [35, 160, 72, 1], //边界颜色
          }),
        })
      );
    } else if (lineData.type == "Point") {
      const point = new Point(lineData.coordinates);
      const fill = new Fill({
        color: "green",
      });
      const stroke = new Stroke({
        color: "green",
        width: 25,
      });
      const styles = [
        new Style({
          image: new Circle({
            fill: fill,
            stroke: stroke,
            radius: 5,
          }),
          fill: fill,
          stroke: stroke,
        }),
      ];

      // 创建矢量对象
      routeFeature = new Feature({
        geometry: point,
        // style: styles
      });
      routeFeature.setStyle(
        new Style({
          image: new Icon({
            anchor: [0.5, 0.5],
            crossOrigin: "anonymous",
            src: "https://openlayers.org/en/v4.6.5/examples/data/icon.png",
            scale: 1,
          }),
        })
      );
      // 创建矢量源
    } else {
      console.log("不是");
    }
    source.addFeature(routeFeature);
  });

  // 添加图层
  myMap.addLayer(routeLayer);
  const view = myMap.getView();
  view.setZoom(11);
  view.animate({
    center: [114.0549, 34.7473],
    duration: 1,
  });
}
const LineStyleFunction = (offset: number) => {
  let styles = [
                new Style({
                  fill: new Fill({
                    color: "rgba(35, 160, 72, 1)", //填充颜色
                  }),
                  stroke: new Stroke({
                    width: 2, //边界宽度
                    color: [35, 160, 72, 1], //边界颜色
                  }),
                }),
                tmLineStyle(offset),
              ]
              return styles
}
const tmLineStyle = (offset: number) => {
  return new Style({
    stroke: new Stroke({
      color: "#ffffff",
      width: 2,
      lineDash: [2, 7],
      lineDashOffset: offset,
    }),
    fill: new Fill({
      color: [57, 156, 238, 0.5],
    }),
  });
};
onMounted(() => {
  myMap = new initMap(mapContainer.value).map;
  getGeojson();
});
</script>
<style lang="scss">
.MapContainer {
  width: 100vw;
  height: 100vh;
}

.popup-content {
  background-color: #fff;
  border: 1px solid #000;
  padding: 12px 8px;
  border-radius: 8px;
  position: relative;
}
</style>
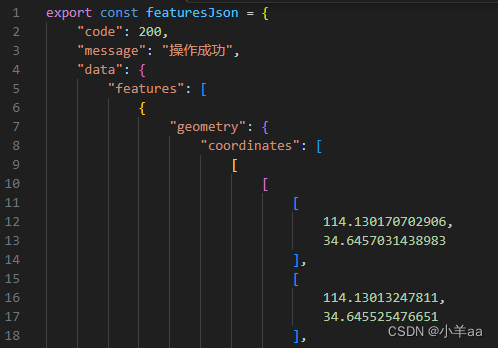
注意:featuresJson为接口数据主要格式如下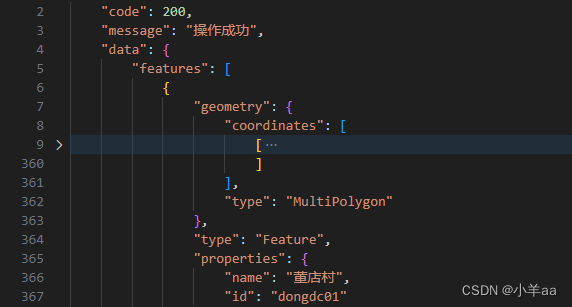
vuejs/vue: 是一个用于构建用户界面的 JavaScript 框架,具有简洁的语法和丰富的组件库,可以用于开发单页面应用程序和多页面应用程序。
最近提交(Master分支:3 个月前 )
9e887079
[skip ci] 1 年前
73486cb5
* chore: fix link broken
Signed-off-by: snoppy <michaleli@foxmail.com>
* Update packages/template-compiler/README.md [skip ci]
---------
Signed-off-by: snoppy <michaleli@foxmail.com>
Co-authored-by: Eduardo San Martin Morote <posva@users.noreply.github.com> 1 年前

AtomGit 是由开放原子开源基金会联合 CSDN 等生态伙伴共同推出的新一代开源与人工智能协作平台。平台坚持“开放、中立、公益”的理念,把代码托管、模型共享、数据集托管、智能体开发体验和算力服务整合在一起,为开发者提供从开发、训练到部署的一站式体验。
更多推荐


 15
15 0
0- 0


 已为社区贡献3条内容

所有评论(0)