
vue3.0 + echarts 地图下级地图切换
vue
vuejs/vue: 是一个用于构建用户界面的 JavaScript 框架,具有简洁的语法和丰富的组件库,可以用于开发单页面应用程序和多页面应用程序。
项目地址:https://gitcode.com/gh_mirrors/vu/vue
·
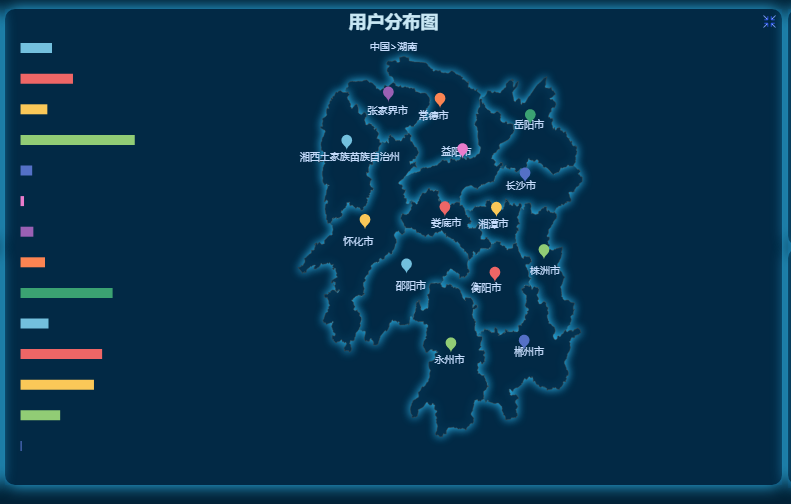
vue3.0 + echarts 实现地图 下级 返回
先发效果图 是我的习惯

在vue3.0中引入echarts
- npm install echarts --save 安装
- import * as echarts from ‘echarts’ 在需要的地方引入
- 地图数据 api 官网
- echarts官网地址
地图下转
- 初始化中国地图
- 点击省地图 添加省相关标点的或者需要展示的数据
- 合并替换数据 依次类推 实现 全球 >中国>xx省>xx市>xx县> …
地图返回
1.点击下级地图之前 先存储当前已实例化的对象
2.判断当前所在县/市 获取以存储对应的对象
3.合并替换数据 依次类推 实现 xx县<xx市<xx省<中国<全球<宇宙…
部分代码示例
//在html 中创建div 我这里是随机生成的id
<div class="chart" :id="id.userDistribution"></div>
// 引入中国地图 也可以直接调用api 我建议把china.json下载本地引用 子级地图在调用api

const china = require('./china.json')
const state = reactive({
.......
id: {
   userDistribution: Math.random().toString(36).slice(-8)
}
chartConfig:{
     userDistribution: {
       title: {
         text: '用户分布图',
         x: 'center',
         subtext: '中国',
         textStyle: {
           color: Colour['--el-text-color-primary']
         },
         subtextStyle: {
           color: Colour['--el-text-color-regular'],
           fontSize: '10'
         }
       },
       toolbox: {
         showTitle: false,
         orient: 'vertical',
         feature: {
           restore: {
             show: false,
             icon: 'image://data:image/png;base64,.......'
           }
         }
       },
       geo: {
         map: 'china',
         regions: ((data) => {
           const arr = []
           data.forEach(key => {
             arr.push({
               name: key.properties.name,
               adcode: key.properties.adcode,
               switchover: key.properties.level,
               childrenNum: key.properties.childrenNum
             })
           })
           return arr
         })(china.features),
         label: {
           show: true,
           color: Colour['--el-text-color-regular'],
           fontSize: 10
         },
         layoutCenter: ['56%', '50%'],
         layoutSize: '120%',
         emphasis: { // 鼠标悬浮
           label: {
             show: true,
             color: Colour['--el-text-color-primary']
           },
           itemStyle: {
             areaColor: Colour['--el-color-primary-light-1'],
             borderColor: Colour['--el-border-color-base']
           }
         },
         itemStyle: {
           areaColor: Colour['--el-background-color-base'], // 地图颜色
           shadowColor: Colour['--el-shadowColor'],
           shadowBlur: 10
         },
         zoom: 1,
         roam: false,
         scaleLimit: { min: 1, max: 1.5 },
         tooltip: {
           show: false
         }
       },
       tooltip: {
         backgroundColor: Colour['--el-popup-background-color'],
         textStyle: {
           color: Colour['--el-text-color-regular']
         }
       },
       dataset: {
         source: ((data) => {
           const arr = []
           data.forEach(key => {
             arr.push({
               name: key.properties.name,
               value: Math.round(Math.random() * 100)
             })
           })
           return arr
         })(china.features)
       },
       xAxis: {
         show: false
       },
       yAxis: {
         type: 'category',
         axisLine: {
           show: false
         },
         axisTick: {
           show: false
         },
         axisLabel: {
           show: false
         }
       },
       grid: {
         left: '2%',
         top: '5%',
         width: '15%',
         height: '90%'
       },
       series: [
         {
           type: 'effectScatter',
           coordinateSystem: 'geo',
           data: ((data) => {
             const arr = []
             data.forEach(key => {
               arr.push({
                 name: key.properties.name,
                 value: key.properties.cp.concat(Math.round(Math.random() * 100))
               })
             })
             return arr
           })(china.features),
           colorBy: 'data',
           symbol: 'pin',
           showEffectOn: 'emphasis',
           rippleEffect: {
             number: 10,
             scale: 5,
             brushType: 'stroke'
           },
           symbolSize: 18,
           symbolOffset: [0, '-30%'],
           tooltip: {
             show: true,
             trigger: 'item',
             triggerOn: 'mousemove',
             formatter: (e) => {
               return `${e.marker} ${e.data.name} ${e.data.value[2]} 万`
             }
           }
         },
         {
           type: 'bar',
           colorBy: 'data',
           barWidth: '10',
           barMaxWidth: '20',
           barMinWidth: '10',
           encode: {
             x: 'value',
             y: 'name'
           },
           tooltip: {
             trigger: 'item',
             triggerOn: 'click',
             formatter: (e) => {
               return `${e.marker} ${e.value.name} ${e.value.value} 万`
             }
           }
         }
       ]
     }
// 配置仅供参考 不要直接复制  其中 Colour['--el-text-color-regular'] 是我自定义全局主题颜色
}
.......
})

// 初始化实例     我这个页面有多个图表  chartinit(id, 图表配置)
onMounted(() => {
     Object.keys(state.id).forEach(key => {
       chartinit(state.id[key], state.chartConfig[key])
     })
     userDistributionEvent()
})
 const chartinit = (id, data) => {
   const chart = echarts.init(document.getElementById(id))
   chart.setOption(data)
   state.chartObject[id] = chart
   window.addEventListener('resize', () => {
     chart.resize()
   })
 }

 /**
  * @description 切换地图
  */
 const switchover = (e, mapdata, name, mapjson, size = '120%') => {
   echarts.registerMap(e.region.adcode, mapjson)
   mapdata.title.subtext = name
   mapdata.geo.map = e.region.adcode
   mapdata.geo.scaleLimit.max = 5
   mapdata.geo.layoutSize = size
   mapdata.geo.roam = true
   mapdata.toolbox.feature.restore.show = true
   state.chartObject[state.id.userDistribution].setOption(mapdata)
 }
 /**
  * @description 请求地图数据
  * @param e
  * @param parameter
  * @param chart
  * @param callBack
  * @constructor
  */
 const GetMapData = (e, parameter, chart, callBack) => {
   map({ code: parameter }).then(res => {
     if (res.features.length !== 0) {
       callBack(res)
     }
   }).catch(() => {
     chart.hideLoading()
     proxy.Message(`${e.region.name} 加载失败`, 'warning')
   })
 }

 /**
  * @description 返回上一级地图
  * @param chart
  * @param type
  * @param Loading
  * @returns {Promise<void>}
  * @constructor
  */
 const MapSuperior = async (chart, type, Loading) => {
   chart.showLoading(Loading)
   await proxy.sleep(200)
   chart.setOption(type)
 }
   /**
    * @description 分布图鼠标点击事件
    */
   userDistributionEvent: () => {
     const Loading = {
       text: '加载中....',
       color: '#03e4f9',
       textColor: '#03e4f9',
       maskColor: 'rgba(0,33,52,0.75)',
       fontSize: 15,
       showSpinner: true,
       spinnerRadius: 20,
       lineWidth: 5
     }
     const chart = state.chartObject[state.id.userDistribution]
     const data = state.chartConfig.userDistribution
     chart.on('click', 'geo', (e) => {
       if (e.region.childrenNum <= 1) return false
       const [regions, source, seriesdata] = [[], [], []]
       const parameter = e.region.childrenNum <= 1 ? e.region.adcode : `${e.region.adcode}_full`
       if (e.region.switchover === 'province') {
         state.switchoverMapData.china = chart.getOption()
         chart.showLoading(Loading)
         GetMapData(e, parameter, chart, (res) => {
           data.geo.regions = ((value) => {
             value.forEach(key => {
               regions.push({
                 name: key.properties.name,
                 adcode: key.properties.adcode,
                 switchover: key.properties.level,
                 childrenNum: key.properties.childrenNum
               })
             })
             return regions
           })(res.features)
           data.dataset.source = ((value) => {
             value.forEach(key => {
               source.push({
                 name: key.properties.name,
                 value: Math.round(Math.random() * 100)
               })
             })
             return source
           })(res.features)
           data.series[0].data = ((value) => {
             value.forEach(key => {
               const coord = key.properties.centroid ? key.properties.centroid : key.properties.center
               seriesdata.push({
                 name: key.properties.name,
                 value: coord.concat(Math.round(Math.random() * 100))
               })
             })
             return seriesdata
           })(res.features)
           switchover(e, data, `中国>${e.region.name}`, res, '80%')
           chart.hideLoading()
         })
       }
       if (e.region.switchover === 'city') {
         state.switchoverMapData.province = chart.getOption()
         chart.showLoading(Loading)
         GetMapData(e, parameter, chart, (res) => {
           data.geo.regions = ((value) => {
             value.forEach(key => {
               regions.push({
                 name: key.properties.name,
                 adcode: key.properties.adcode,
                 switchover: key.properties.level,
                 childrenNum: key.properties.childrenNum
               })
             })
             return regions
           })(res.features)
           data.dataset.source = ((value) => {
             value.forEach(key => {
               source.push({
                 name: key.properties.name,
                 value: Math.round(Math.random() * 100)
               })
             })
             return source
           })(res.features)
           data.series[0].data = ((value) => {
             value.forEach(key => {
               const coord = key.properties.centroid ? key.properties.centroid : key.properties.center
               seriesdata.push({
                 name: key.properties.name,
                 value: coord.concat(Math.round(Math.random() * 100))
               })
             })
             return seriesdata
           })(res.features)
           switchover(e, data, `${data.title.subtext}>${e.region.name}`, res, '80%')
           chart.hideLoading()
         })
       }
     })
     chart.on('contextmenu', 'geo', (e) => {
       if (e.region.switchover === 'district') {
         MapSuperior(chart, state.switchoverMapData.province, Loading).then(() => {
           chart.hideLoading()
         })
       }
       if (e.region.switchover === 'city') {
         MapSuperior(chart, state.switchoverMapData.china, Loading).then(() => {
           chart.hideLoading()
         })
       }
     })
   }
我习惯了把js 代码全部抽离分文件写
/**
 *Dashboard.js     当前文件名
 *2021/12/12-16:53  创建时间
 *PhpStorm  IDE名称
 *作者:  蒋步国<email:15616888806@163.com>
 */
import { toRefs, getCurrentInstance, onMounted } from 'vue'
import { ElRow, ElCol, ElCarousel, ElCarouselItem } from 'element-plus'
import reactive from './reactive.js'
import method from './method.js'
export default {
  name: 'Dashboard',
  components: {
    ElRow, ElCol, ElCarousel, ElCarouselItem
  },
  setup () {
    const { proxy } = getCurrentInstance()
    const { state } = reactive(proxy)
    const { chartinit, userDistributionEvent } = method(state, proxy)
    onMounted(() => {
      Object.keys(state.id).forEach(key => {
        chartinit(state.id[key], state.chartConfig[key])
      })
      userDistributionEvent()
    })
    return {
      ...toRefs(state)
    }
  }
}
/**
*Dashboard.vue     当前文件名
*2021/12/12-16:47  创建时间
*PhpStorm  IDE名称
*作者:  蒋步国 email:15616888806@163.com
*/
<template>
......
<div class="chart" :id="id.userTerminal"></div>
......
</template>
<script>
import Dashboard from './Dashboard.js'
export default Dashboard
</script>

<style scoped lang="scss">
@import "./Dashboard.scss";
</style>

/**
 *method.js     当前文件名
 *2021/12/12-16:55  创建时间
 *PhpStorm  IDE名称
 *作者:  蒋步国<email:15616888806@163.com>
 */
import * as echarts from 'echarts'
import { map } from '../../../api/administrator'
export default function (state, proxy) {
  /**
   * 图表初始化
   * @param id
   * @param data
   */
  const chartinit = (id, data) => {
    const chart = echarts.init(document.getElementById(id))
    chart.setOption(data)
    state.chartObject[id] = chart
    window.addEventListener('resize', () => {
      chart.resize()
    })
  }
  /**
   * @description 切换地图
   */
  const switchover = (e, mapdata, name, mapjson, size = '120%') => {
    echarts.registerMap(e.region.adcode, mapjson)
    mapdata.title.subtext = name
    mapdata.geo.map = e.region.adcode
    mapdata.geo.scaleLimit.max = 5
    mapdata.geo.layoutSize = size
    mapdata.geo.roam = true
    mapdata.toolbox.feature.restore.show = true
    state.chartObject[state.id.userDistribution].setOption(mapdata)
  }
  /**
   * @description 请求地图数据
   * @param e
   * @param parameter
   * @param chart
   * @param callBack
   * @constructor
   */
  const GetMapData = (e, parameter, chart, callBack) => {
    map({ code: parameter }).then(res => {
      if (res.features.length !== 0) {
        callBack(res)
      }
    }).catch(() => {
      chart.hideLoading()
      proxy.Message(`${e.region.name} 加载失败`, 'warning')
    })
  }
  /**
   * @description 返回上一级地图
   * @param chart
   * @param type
   * @param Loading
   * @returns {Promise<void>}
   * @constructor
   */
  const MapSuperior = async (chart, type, Loading) => {
    chart.showLoading(Loading)
    await proxy.sleep(200)
    chart.setOption(type)
  }
  return {
    chartinit, // 初始化图表
    /**
     * @description 分布图鼠标点击事件
     */
    userDistributionEvent: () => {
      const Loading = {
        text: '加载中....',
        color: '#03e4f9',
        textColor: '#03e4f9',
        maskColor: 'rgba(0,33,52,0.75)',
        fontSize: 15,
        showSpinner: true,
        spinnerRadius: 20,
        lineWidth: 5
      }
      const chart = state.chartObject[state.id.userDistribution]
      const data = state.chartConfig.userDistribution
      chart.on('click', 'geo', (e) => {
        if (e.region.childrenNum <= 1) return false
        const [regions, source, seriesdata] = [[], [], []]
        const parameter = e.region.childrenNum <= 1 ? e.region.adcode : `${e.region.adcode}_full`
        if (e.region.switchover === 'province') {
          state.switchoverMapData.china = chart.getOption()
          chart.showLoading(Loading)
          GetMapData(e, parameter, chart, (res) => {
            data.geo.regions = ((value) => {
              value.forEach(key => {
                regions.push({
                  name: key.properties.name,
                  adcode: key.properties.adcode,
                  switchover: key.properties.level,
                  childrenNum: key.properties.childrenNum
                })
              })
              return regions
            })(res.features)
            data.dataset.source = ((value) => {
              value.forEach(key => {
                source.push({
                  name: key.properties.name,
                  value: Math.round(Math.random() * 100)
                })
              })
              return source
            })(res.features)
            data.series[0].data = ((value) => {
              value.forEach(key => {
                const coord = key.properties.centroid ? key.properties.centroid : key.properties.center
                seriesdata.push({
                  name: key.properties.name,
                  value: coord.concat(Math.round(Math.random() * 100))
                })
              })
              return seriesdata
            })(res.features)
            switchover(e, data, `中国>${e.region.name}`, res, '80%')
            chart.hideLoading()
          })
        }
        if (e.region.switchover === 'city') {
          state.switchoverMapData.province = chart.getOption()
          chart.showLoading(Loading)
          GetMapData(e, parameter, chart, (res) => {
            data.geo.regions = ((value) => {
              value.forEach(key => {
                regions.push({
                  name: key.properties.name,
                  adcode: key.properties.adcode,
                  switchover: key.properties.level,
                  childrenNum: key.properties.childrenNum
                })
              })
              return regions
            })(res.features)
            data.dataset.source = ((value) => {
              value.forEach(key => {
                source.push({
                  name: key.properties.name,
                  value: Math.round(Math.random() * 100)
                })
              })
              return source
            })(res.features)
            data.series[0].data = ((value) => {
              value.forEach(key => {
                const coord = key.properties.centroid ? key.properties.centroid : key.properties.center
                seriesdata.push({
                  name: key.properties.name,
                  value: coord.concat(Math.round(Math.random() * 100))
                })
              })
              return seriesdata
            })(res.features)
            switchover(e, data, `${data.title.subtext}>${e.region.name}`, res, '80%')
            chart.hideLoading()
          })
        }
      })
      chart.on('contextmenu', 'geo', (e) => {
        if (e.region.switchover === 'district') {
          MapSuperior(chart, state.switchoverMapData.province, Loading).then(() => {
            chart.hideLoading()
          })
        }
        if (e.region.switchover === 'city') {
          MapSuperior(chart, state.switchoverMapData.china, Loading).then(() => {
            chart.hideLoading()
          })
        }
      })
    }
  }
}

/**
 *reactive.js     当前文件名
 *2021/12/12-16:54  创建时间
 *PhpStorm  IDE名称
 *作者:  蒋步国<email:15616888806@163.com>
 */
import { reactive } from 'vue'
import Theme from '../Home/ThemeSettings/Theme'
import * as echarts from 'echarts'
const china = require('./china.json')
const theme = new Theme()
export default function (proxy) {
  // 初始化中国地图
  echarts.registerMap('china', china)
  const Colour = theme.getColour(proxy)
  const state = reactive({具体配置前面有了})
  return { state }
}
js代码抽离目录示例图

vuejs/vue: 是一个用于构建用户界面的 JavaScript 框架,具有简洁的语法和丰富的组件库,可以用于开发单页面应用程序和多页面应用程序。
最近提交(Master分支:2 个月前 )
73486cb5
* chore: fix link broken
Signed-off-by: snoppy <michaleli@foxmail.com>
* Update packages/template-compiler/README.md [skip ci]
---------
Signed-off-by: snoppy <michaleli@foxmail.com>
Co-authored-by: Eduardo San Martin Morote <posva@users.noreply.github.com> 4 个月前
e428d891
Updated Browser Compatibility reference. The previous currently returns HTTP 404. 4 个月前

旨在为数千万中国开发者提供一个无缝且高效的云端环境,以支持学习、使用和贡献开源项目。
更多推荐
 2
2 0
0- 0


 已为社区贡献1条内容

所有评论(0)