
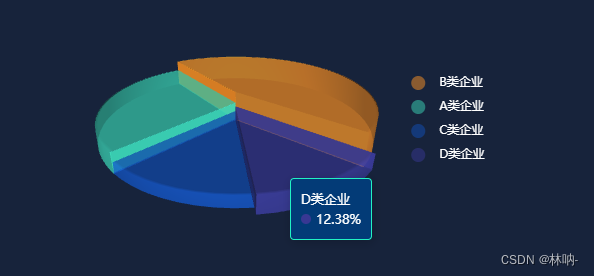
vue3+echarts实现3D饼图
vue
vuejs/vue: 是一个用于构建用户界面的 JavaScript 框架,具有简洁的语法和丰富的组件库,可以用于开发单页面应用程序和多页面应用程序。
项目地址:https://gitcode.com/gh_mirrors/vu/vue
·

示列1

示列2
实现步骤;
第一步;
npm install echarts --save
npm install --save echarts-gl
第二步;
封装pie3D组件
<template>
  <div class="chart-container">
    <div class="chart" ref="echartRef" style="width: 100%; height: 300px"></div>
  </div>
</template>

<script setup lang="ts">
import * as echarts from "echarts";
import "echarts-gl";
import {
  getPie3D,
  getParametricEquation,
} from "./echart.js";
import { ref, shallowRef, onMounted, nextTick } from "vue";

const props = defineProps({
  data: {
    type: Array,
    required: true,
  },
  internalDiameterRatio: {
    type: Number,
    default: 0.6,
  },
  distance: {
    type: Number,
    default: 180,
  },
  alpha: {
    type: Number,
    default: 26,
  },
  pieHeight: {
    type: Number,
    default: 18,
  },
  opacity: {
    type: Number,
    default: 0.5,
  },
});

const color = ["#3cd6b7", "#fe9326", "#124fb7", "#383893"];
const optionData = ref(props.data);

let option = {};
const echartRef = shallowRef<HTMLElement>();
const echart = shallowRef<echarts.ECharts>();

onMounted(() => {
  nextTick(() => {
    setLabel();
    initChart();
  });
  window.onresize = changeSize;
});

const setLabel = () => {
  optionData.value.forEach((item, index) => {
    item.itemStyle = {
      color: color[index],
    };
    item.label = {
      normal: {
        show: false,
        color: color[index],
        position: "right",
        offset: [0, 3],
        formatter: ["{d|{d}%}", "————", "{b|{b}}"].join("\n"),
        rich: {
          b: {
            lineHeight: 25,
            align: "left",
            color: color[index],
          },
          c: {
            fontSize: 22,
            textShadowColor: "#1c90a6",
            textShadowOffsetX: 0,
            textShadowOffsetY: 2,
            textShadowBlur: 5,
            color: color[index],
          },
          d: {
            color: color[index],
            align: "left",
          },
        },
      },
    };
    item.labelLine = {
      normal: {
        length2: 30,
        lineStyle: {
          width: 1,
          color: color[index],
        },
      },
    };
  });
};

const initChart = () => {
  echart.value = echarts.init(echartRef.value);

  option = getPie3D(
    optionData.value,
    props.internalDiameterRatio,
    props.distance,
    props.alpha,
    props.pieHeight,
    props.opacity
  );

  echart.value.setOption(option);

  option.series.push({
    name: "信用评价",
    backgroundColor: "transparent",
    type: "pie",
    label: {
      opacity: 1,
      fontSize: 13,
      lineHeight: 20,
      show: false,
    },
    startAngle: -40,
    clockwise: false,
    data: optionData.value,
    itemStyle: {
      opacity: 0,
    },
  });
  echart.value.setOption(option);

  bindListen(echart.value);
};

const bindListen = (myChart) => {
  let selectedIndex = "";
  let hoveredIndex = -1;

  myChart.on("mouseover", (params) => {
    let isSelected;
    let isHovered;
    let startRatio;
    let endRatio;
    let k;

    if (hoveredIndex === params.seriesIndex) {
      // Do nothing
    } else {
      if (hoveredIndex !== "" && hoveredIndex !== -1) {
        isSelected = option.series[hoveredIndex].pieStatus.selected;
        isHovered = false;
        startRatio = option.series[hoveredIndex].pieData.startRatio;
        endRatio = option.series[hoveredIndex].pieData.endRatio;
        k = option.series[hoveredIndex].pieStatus.k;

        if (
          typeof startRatio !== "undefined" &&
          typeof endRatio !== "undefined" &&
          typeof k !== "undefined"
        ) {
          option.series[hoveredIndex].parametricEquation =
            getParametricEquation(
              startRatio,
              endRatio,
              isSelected,
              isHovered,
              k,
              option.series[hoveredIndex].pieData.value
            );
        }

        option.series[hoveredIndex].pieStatus.hovered = isHovered;
        hoveredIndex = "";
      }

      if (
        params.seriesName !== "mouseoutSeries" &&
        params.seriesName !== "信用评价"
      ) {
        isSelected = option.series[params.seriesIndex].pieStatus.selected;
        isHovered = true;
        startRatio = option.series[params.seriesIndex].pieData.startRatio;
        endRatio = option.series[params.seriesIndex].pieData.endRatio;
        k = option.series[params.seriesIndex].pieStatus.k;

        if (
          typeof startRatio !== "undefined" &&
          typeof endRatio !== "undefined" &&
          typeof k !== "undefined"
        ) {
          option.series[params.seriesIndex].parametricEquation =
            getParametricEquation(
              startRatio,
              endRatio,
              isSelected,
              isHovered,
              k,
              option.series[params.seriesIndex].pieData.value + 60
            );
          option.series[params.seriesIndex].pieStatus.hovered = isHovered;
          hoveredIndex = params.seriesIndex;
        }
      }

      myChart.setOption(option);
    }
  });

  myChart.on("globalout", () => {
    let isSelected;
    let isHovered;
    let startRatio;
    let endRatio;
    let k;

    if (hoveredIndex !== "" && hoveredIndex !== -1) {
      isSelected = option.series[hoveredIndex].pieStatus.selected;
      isHovered = false;
      k = option.series[hoveredIndex].pieStatus.k;
      startRatio = option.series[hoveredIndex].pieData.startRatio;
      endRatio = option.series[hoveredIndex].pieData.endRatio;

      if (
        typeof startRatio !== "undefined" &&
        typeof endRatio !== "undefined" &&
        typeof k !== "undefined"
      ) {
        option.series[hoveredIndex].parametricEquation = getParametricEquation(
          startRatio,
          endRatio,
          isSelected,
          isHovered,
          k,
          option.series[hoveredIndex].pieData.value
        );
      }

      option.series[hoveredIndex].pieStatus.hovered = isHovered;
      hoveredIndex = "";
    }

    myChart.setOption(option);
  });
};

const changeSize = () => {
  echart.value && echart.value.resize();
};
</script>
第三步;
创建echart.js
/**
 * 绘制3d图
 * @param pieData 总数据
 * @param internalDiameterRatio:透明的空心占比
 * @param distance 视角到主体的距离
 * @param alpha 旋转角度
 * @param pieHeight 立体的高度
 * @param opacity 饼或者环的透明度
 */
const getPie3D = (
  pieData,
  internalDiameterRatio,
  distance,
  alpha,
  pieHeight,
  opacity = 1
) => {
  const series = [];
  let sumValue = 0;
  let startValue = 0;
  let endValue = 0;
  let legendData = [];
  let legendBfb = [];
  const k = 1 - internalDiameterRatio; //设置是否镂空
  pieData.sort((a, b) => {
    return b.value - a.value;
  });
  // 为每一个饼图数据,生成一个 series-surface 配置
  for (let i = 0; i < pieData.length; i++) {
    sumValue += pieData[i].value;
    const seriesItem = {
      name:
        typeof pieData[i].name === "undefined" ? `series${i}` : pieData[i].name,
      type: "surface",
      parametric: true,
      wireframe: {
        show: false,
      },
      pieData: pieData[i],
      pieStatus: {
        selected: false,
        hovered: false,
        k: k,
      },
    };
    if (typeof pieData[i].itemStyle !== "undefined") {
      const itemStyle = {};
      itemStyle.color =
        typeof pieData[i].itemStyle.color !== "undefined"
          ? pieData[i].itemStyle.color
          : opacity;
      itemStyle.opacity =
        typeof pieData[i].itemStyle.opacity !== "undefined"
          ? pieData[i].itemStyle.opacity
          : opacity;
      seriesItem.itemStyle = itemStyle;
    }
    series.push(seriesItem);
  }

  // 使用上一次遍历时,计算出的数据和 sumValue,调用 getParametricEquation 函数,
  // 向每个 series-surface 传入不同的参数方程 series-surface.parametricEquation,也就是实现每一个扇形。
  legendData = [];
  legendBfb = [];
  for (let i = 0; i < series.length; i++) {
    endValue = startValue + series[i].pieData.value;
    series[i].pieData.startRatio = startValue / sumValue;
    series[i].pieData.endRatio = endValue / sumValue;
    series[i].parametricEquation = getParametricEquation(
      series[i].pieData.startRatio,
      series[i].pieData.endRatio,
      false,
      false,
      k,
      series[i].pieData.value
    );
    startValue = endValue;
    const bfb = fomatFloat(series[i].pieData.value / sumValue, 4);
    legendData.push({
      name: series[i].name,
      value: bfb,
    });
    legendBfb.push({
      name: series[i].name,
      value: bfb,
    });
  }
  const boxHeight = getHeight3D(series, pieHeight); // 通过pieHeight设定3d饼/环的高度,单位是px
  // 准备待返回的配置项,把准备好的 legendData、series 传入。
  const option = {
    legend: {
      show: true,
      data: legendData,
      orient: "vertical",
      right: "35%",
      top: "center",
      itemGap: 10,
      icon: "circle",
      formatter: function (param) {
        const item = legendBfb.filter((item) => item.name === param)[0];
        return ` ${item.name}`;
      },
      textStyle: {
        color: "#fff",
      },
    },
    labelLine: {
      show: true,
      lineStyle: {
        color: "#fff",
      },
    },
    label: {
      show: true,
      position: "outside",
      formatter: "{b} \n{c} {d}%",
    },
    tooltip: {
      backgroundColor: "#033b77",
      borderColor: "#21f2c4",
      textStyle: {
        color: "#fff",
        fontSize: 13,
      },
      formatter: (params) => {
        if (
          params.seriesName !== "mouseoutSeries" &&
          params.seriesName !== "信用评价"
        ) {
          const bfb = (
            (option.series[params.seriesIndex].pieData.endRatio -
              option.series[params.seriesIndex].pieData.startRatio) *
            100
          ).toFixed(2);
          return (
            `${params.seriesName}<br/>` +
            `<span style="display:inline-block;margin-right:5px;border-radius:10px;width:10px;height:10px;background-color:${params.color};"></span>` +
            `${bfb}%`
          );
        }
      },
    },
    xAxis3D: {
      min: -1,
      max: 1,
    },
    yAxis3D: {
      min: -1,
      max: 1,
    },
    zAxis3D: {
      min: -1,
      max: 1,
    },
    grid3D: {
      show: false,
      boxHeight: boxHeight, // 圆环的高度
      viewControl: {
        // 3d效果可以放大、旋转等,请自己去查看官方配置
        alpha, // 角度
        distance: 250, // 调整视角到主体的距离,类似调整zoom
        rotateSensitivity: 0, // 设置为0无法旋转
        zoomSensitivity: 0, // 设置为0无法缩放
        panSensitivity: 0, // 设置为0无法平移
        autoRotate: false, // 自动旋转
      },
    },
    series: series,
  };
  return option;
};

/**
 * 生成扇形的曲面参数方程,用于 series-surface.parametricEquation
 */
const getParametricEquation = (
  startRatio,
  endRatio,
  isSelected,
  isHovered,
  k,
  h
) => {
  startRatio = startRatio !== undefined ? startRatio : 0;
  endRatio = endRatio !== undefined ? endRatio : 1;
  // 计算
  const midRatio = (startRatio + endRatio) / 2;
  const startRadian = startRatio * Math.PI * 2;
  const endRadian = endRatio * Math.PI * 2;
  const midRadian = midRatio * Math.PI * 2;
  // 如果只有一个扇形,则不实现选中效果。
  if (startRatio === 0 && endRatio === 1) {
    isSelected = false;
  }
  // 通过扇形内径/外径的值,换算出辅助参数 k(默认值 1/3)
  k = typeof k !== "undefined" ? k : 1 / 3;
  // 计算选中效果分别在 x 轴、y 轴方向上的位移(未选中,则位移均为 0)
  const offsetX = isSelected ? Math.cos(midRadian) * 0.1 : 0;
  const offsetY = isSelected ? Math.sin(midRadian) * 0.1 : 0;
  // 计算高亮效果的放大比例(未高亮,则比例为 1)
  const hoverRate = isHovered ? 1.05 : 1;
  // 返回曲面参数方程
  return {
    u: {
      min: -Math.PI,
      max: Math.PI * 3,
      step: Math.PI / 32,
    },
    v: {
      min: 0,
      max: Math.PI * 2,
      step: Math.PI / 20,
    },
    x: function (u, v) {
      if (u < startRadian) {
        return (
          offsetX + Math.cos(startRadian) * (1 + Math.cos(v) * k) * hoverRate
        );
      }
      if (u > endRadian) {
        return (
          offsetX + Math.cos(endRadian) * (1 + Math.cos(v) * k) * hoverRate
        );
      }
      return offsetX + Math.cos(u) * (1 + Math.cos(v) * k) * hoverRate;
    },
    y: function (u, v) {
      if (u < startRadian) {
        return (
          offsetY + Math.sin(startRadian) * (1 + Math.cos(v) * k) * hoverRate
        );
      }
      if (u > endRadian) {
        return (
          offsetY + Math.sin(endRadian) * (1 + Math.cos(v) * k) * hoverRate
        );
      }
      return offsetY + Math.sin(u) * (1 + Math.cos(v) * k) * hoverRate;
    },
    z: function (u, v) {
      if (u < -Math.PI * 0.5) {
        return Math.sin(u);
      }
      if (u > Math.PI * 2.5) {
        return Math.sin(u) * h * 0.1;
      }
      return Math.sin(v) > 0 ? 1 * h * 0.1 : -1;
    },
  };
};

/**
 * 获取3d丙图的最高扇区的高度
 */
const getHeight3D = (series, height) => {
  series.sort((a, b) => {
    return b.pieData.value - a.pieData.value;
  });
  return (height * 25) / series[0].pieData.value;
};

/**
 * 格式化浮点数
 */
const fomatFloat = (num, n) => {
  let f = parseFloat(num);
  if (isNaN(f)) {
    return false;
  }
  f = Math.round(num * Math.pow(10, n)) / Math.pow(10, n); // n 幂
  let s = f.toString();
  let rs = s.indexOf(".");
  // 判定如果是整数,增加小数点再补0
  if (rs < 0) {
    rs = s.length;
    s += ".";
  }
  while (s.length <= rs + n) {
    s += "0";
  }
  return s;
};

export { getPie3D, getParametricEquation };
第四步;
引入封装组件使用
<!-- 3D饼图 -->
<template>
  <div class="chart-container">
    <Pie3D :data="pieData" />
  </div>
</template>

<script setup lang="ts">
import Pie3D from "@/views/demo/echarts3D/components/pie3D.vue";
const pieData = ref<Array<any>>([
  {
    name: "A类企业",
    value: 176,
  },
  {
    name: "B类企业",
    value: 288,
  },
  {
    name: "C类企业",
    value: 88,
  },
  {
    name: "D类企业",
    value: 78,
  },
]);
</script>
<style scoped>
.chart-container {
  height: 100vh;
  background-color: #17233b;
}
</style>
如果需要镂空 只需要传入internalDiameterRatio 0.6即可
<Pie3D :data="pieData" :internalDiameterRatio="0.6" />更新2024-06-24 解决数据为0的时候显示问题
   // 判断所有数据是否均为0,如果是0,则设置一个最小值,防止出现扇形的面积为0的情况
    if (pieData.every((item) => item.value === 0)) {
      sumValue += 1;
    } else {
      sumValue += pieData[i].value;
    }
完整代码如下;
/**
 * 绘制3d图
 * @param pieData 总数据
 * @param internalDiameterRatio:透明的空心占比
 * @param distance 视角到主体的距离
 * @param alpha 旋转角度
 * @param pieHeight 立体的高度
 * @param opacity 饼或者环的透明度
 */
const getPie3D = (
  pieData,
  internalDiameterRatio,
  distance,
  alpha,
  pieHeight,
  opacity = 1
) => {
  const series = [];
  let sumValue = 0;
  let startValue = 0;
  let endValue = 0;
  let legendData = [];
  let legendBfb = [];
  const k = 1 - internalDiameterRatio; //设置是否镂空
  pieData.sort((a, b) => {
    return b.value - a.value;
  });
  // 为每一个饼图数据,生成一个 series-surface 配置
  for (let i = 0; i < pieData.length; i++) {
    // 判断所有数据是否均为0,如果是0,则设置一个最小值,防止出现扇形的面积为0的情况
    if (pieData.every((item) => item.value === 0)) {
      sumValue += 1;
    } else {
      sumValue += pieData[i].value;
    }
    const seriesItem = {
      name:
        typeof pieData[i].name === "undefined" ? `series${i}` : pieData[i].name,
      type: "surface",
      parametric: true,
      wireframe: {
        show: false,
      },
      pieData: pieData[i],
      pieStatus: {
        selected: false,
        hovered: false,
        k: k,
      },
    };
    if (typeof pieData[i].itemStyle !== "undefined") {
      const itemStyle = {};
      itemStyle.color =
        typeof pieData[i].itemStyle.color !== "undefined"
          ? pieData[i].itemStyle.color
          : opacity;
      itemStyle.opacity =
        typeof pieData[i].itemStyle.opacity !== "undefined"
          ? pieData[i].itemStyle.opacity
          : opacity;
      seriesItem.itemStyle = itemStyle;
    }
    series.push(seriesItem);
  }

  // 使用上一次遍历时,计算出的数据和 sumValue,调用 getParametricEquation 函数,
  // 向每个 series-surface 传入不同的参数方程 series-surface.parametricEquation,也就是实现每一个扇形。
  legendData = [];
  legendBfb = [];
  for (let i = 0; i < series.length; i++) {
    if (pieData.every((item) => item.value === 0)) {
      endValue = startValue + 1;
    } else {
      endValue = startValue + series[i].pieData.value;
    }
    series[i].pieData.startRatio = startValue / sumValue;
    series[i].pieData.endRatio = endValue / sumValue;
    series[i].parametricEquation = getParametricEquation(
      series[i].pieData.startRatio,
      series[i].pieData.endRatio,
      false,
      false,
      k,
      series[i].pieData.value
    );
    startValue = endValue;
    const bfb = fomatFloat(series[i].pieData.value / sumValue, 4);
    legendData.push({
      name: series[i].name,
      value: bfb,
    });
    legendBfb.push({
      name: series[i].name,
      value: bfb,
    });
  }
  const boxHeight = getHeight3D(series, pieHeight); // 通过pieHeight设定3d饼/环的高度,单位是px
  // 准备待返回的配置项,把准备好的 legendData、series 传入。
  const option = {
    title: {
      text: "Referer of a Website",
      subtext: "Fake Data",
      left: "center",
      top: "10%",
      textStyle: {
        color: "#fff", // 将文字颜色设置为白色
      },
      subtextStyle: {
        color: "#fff", // 将 "Fake Data" 文字颜色设置为白色
      },
    },
    legend: {
      show: true,
      data: legendData,
      orient: "vertical",
      right: "35%",
      top: "center",
      itemGap: 10,
      icon: "circle",
      formatter: function (param) {
        const item = legendBfb.filter((item) => item.name === param)[0];
        return ` ${item.name}`;
      },
      textStyle: {
        color: "#fff",
      },
    },
    labelLine: {
      show: true,
      lineStyle: {
        color: "#fff",
      },
    },
    label: {
      show: true,
      position: "outside",
      formatter: "{b} \n{c} {d}%",
    },
    tooltip: {
      backgroundColor: "#033b77",
      borderColor: "#21f2c4",
      textStyle: {
        color: "#fff",
        fontSize: 13,
      },
      formatter: (params) => {
        if (
          params.seriesName !== "mouseoutSeries" &&
          params.seriesName !== "信用评价"
        ) {
          const bfb = (
            (option.series[params.seriesIndex].pieData.endRatio -
              option.series[params.seriesIndex].pieData.startRatio) *
            100
          ).toFixed(2);
          return (
            `${params.seriesName}<br/>` +
            `<span style="display:inline-block;margin-right:5px;border-radius:10px;width:10px;height:10px;background-color:${params.color};"></span>` +
            `${bfb}%`
          );
        }
      },
    },
    xAxis3D: {
      min: -1,
      max: 1,
    },
    yAxis3D: {
      min: -1,
      max: 1,
    },
    zAxis3D: {
      min: -1,
      max: 1,
    },
    grid3D: {
      show: false,
      boxHeight: boxHeight, // 圆环的高度
      viewControl: {
        // 3d效果可以放大、旋转等,请自己去查看官方配置
        alpha, // 角度
        distance: 250, // 调整视角到主体的距离,类似调整zoom
        rotateSensitivity: 0, // 设置为0无法旋转
        zoomSensitivity: 0, // 设置为0无法缩放
        panSensitivity: 0, // 设置为0无法平移
        autoRotate: false, // 自动旋转
      },
    },
    series: series,
  };
  return option;
};

/**
 * 生成扇形的曲面参数方程,用于 series-surface.parametricEquation
 */
const getParametricEquation = (
  startRatio,
  endRatio,
  isSelected,
  isHovered,
  k,
  h
) => {
  startRatio = startRatio !== undefined ? startRatio : 0;
  endRatio = endRatio !== undefined ? endRatio : 1;
  // 计算
  const midRatio = (startRatio + endRatio) / 2;
  const startRadian = startRatio * Math.PI * 2;
  const endRadian = endRatio * Math.PI * 2;
  const midRadian = midRatio * Math.PI * 2;
  // 如果只有一个扇形,则不实现选中效果。
  if (startRatio === 0 && endRatio === 1) {
    isSelected = false;
  }
  // 通过扇形内径/外径的值,换算出辅助参数 k(默认值 1/3)
  k = typeof k !== "undefined" ? k : 1 / 3;
  // 计算选中效果分别在 x 轴、y 轴方向上的位移(未选中,则位移均为 0)
  const offsetX = isSelected ? Math.cos(midRadian) * 0.1 : 0;
  const offsetY = isSelected ? Math.sin(midRadian) * 0.1 : 0;
  // 计算高亮效果的放大比例(未高亮,则比例为 1)
  const hoverRate = isHovered ? 1.05 : 1;
  // 返回曲面参数方程
  return {
    u: {
      min: -Math.PI,
      max: Math.PI * 3,
      step: Math.PI / 32,
    },
    v: {
      min: 0,
      max: Math.PI * 2,
      step: Math.PI / 20,
    },
    x: function (u, v) {
      if (u < startRadian) {
        return (
          offsetX + Math.cos(startRadian) * (1 + Math.cos(v) * k) * hoverRate
        );
      }
      if (u > endRadian) {
        return (
          offsetX + Math.cos(endRadian) * (1 + Math.cos(v) * k) * hoverRate
        );
      }
      return offsetX + Math.cos(u) * (1 + Math.cos(v) * k) * hoverRate;
    },
    y: function (u, v) {
      if (u < startRadian) {
        return (
          offsetY + Math.sin(startRadian) * (1 + Math.cos(v) * k) * hoverRate
        );
      }
      if (u > endRadian) {
        return (
          offsetY + Math.sin(endRadian) * (1 + Math.cos(v) * k) * hoverRate
        );
      }
      return offsetY + Math.sin(u) * (1 + Math.cos(v) * k) * hoverRate;
    },
    z: function (u, v) {
      if (u < -Math.PI * 0.5) {
        return Math.sin(u);
      }
      if (u > Math.PI * 2.5) {
        return Math.sin(u) * h * 0.1;
      }
      return Math.sin(v) > 0 ? 1 * h * 0.1 : -1;
    },
  };
};

/**
 * 获取3d丙图的最高扇区的高度
 */
const getHeight3D = (series, height) => {
  series.sort((a, b) => {
    return b.pieData.value - a.pieData.value;
  });
  return (height * 25) / series[0].pieData.value;
};

/**
 * 格式化浮点数
 */
const fomatFloat = (num, n) => {
  let f = parseFloat(num);
  if (isNaN(f)) {
    return false;
  }
  f = Math.round(num * Math.pow(10, n)) / Math.pow(10, n); // n 幂
  let s = f.toString();
  let rs = s.indexOf(".");
  // 判定如果是整数,增加小数点再补0
  if (rs < 0) {
    rs = s.length;
    s += ".";
  }
  while (s.length <= rs + n) {
    s += "0";
  }
  return s;
};

export { getPie3D, getParametricEquation };
vuejs/vue: 是一个用于构建用户界面的 JavaScript 框架,具有简洁的语法和丰富的组件库,可以用于开发单页面应用程序和多页面应用程序。
最近提交(Master分支:2 个月前 )
73486cb5
* chore: fix link broken
Signed-off-by: snoppy <michaleli@foxmail.com>
* Update packages/template-compiler/README.md [skip ci]
---------
Signed-off-by: snoppy <michaleli@foxmail.com>
Co-authored-by: Eduardo San Martin Morote <posva@users.noreply.github.com> 4 个月前
e428d891
Updated Browser Compatibility reference. The previous currently returns HTTP 404. 4 个月前

旨在为数千万中国开发者提供一个无缝且高效的云端环境,以支持学习、使用和贡献开源项目。
更多推荐
 4
4 0
0- 0


 已为社区贡献1条内容

所有评论(0)