Google Earth Engine(GEE)——利用sentinel-2数据
Sentinel
alibaba/Sentinel: Sentinel 是阿里巴巴开源的一款面向分布式服务架构的流量控制、熔断降级组件,提供实时监控、限流、降级和系统保护功能,适用于微服务治理场景。
项目地址:https://gitcode.com/gh_mirrors/sentine/Sentinel
·
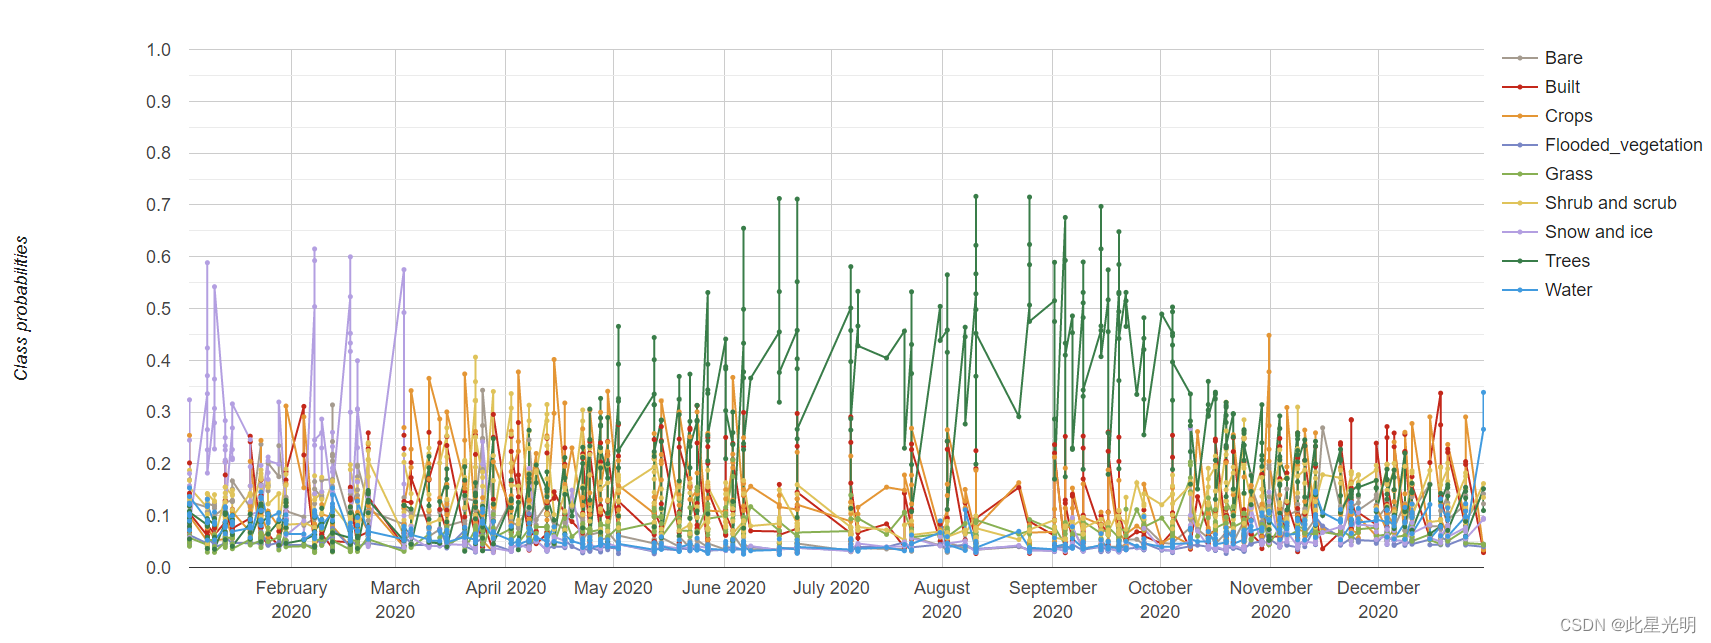
首先针对感兴趣的时间段和位置过滤动态世界集合sentinel-2土地分类数据集。在这里,我们要绘制一年中该位置的变化图表。因此,我们应用过滤器来选择在感兴趣的时间段内在该区域收集的图像。最后,我们选择所有类别的概率波段。
本次用到的函数:
ui.Chart.image.series(imageCollection, region, reducer, scale, xProperty)
从一个ImageCollection生成一个图表。绘制一个区域内每个波段在不同图像中的衍生值。通常是一个时间序列。
X轴。图像,用xProperty值标记。
Y-轴。波段值。
系列。波段名称。
返回一个图表。
参数。
imageCollection(图像集合)。
一个包含数据的ImageCollection,将被包含在图表中。
region (Feature|FeatureCollection|Geometry)。
要减少的区域。
reducer(还原器,可选)。
用于生成Y轴数值的还原器。必须返回一个单一的值。默认为ee.Reducer.mean()。
scale (Number, optional):
与还原器一起使用的刻度,单位是米。
xProperty(字符串,可选)。
作为X轴上每个图像的标签的属性。默认为'system:time_start'。
返回: ui.Chart
代码:
// 随时间变化的类别概率图表
//定义研究区

var table = ee.FeatureCollection("users/bqt2000204051/beijing");
var geometry = table.geometry();
Map.centerObject(geometry, 10);

// 对感兴趣的时间段和地点的动态世界集合进行过滤。
var startDate = '2020-01-01';
var endDate = '2021-01-01';

var dw = ee.ImageCollection('GOOGLE/DYNAMICWORLD/V1')
  .filterDate(startDate, endDate)
  .filterBounds(geometry);

//选择所有波段
var probabilityBands = [
    'water', 'trees', 'grass', 'flooded_vegetation', 'crops',
    'shrub_and_scrub', 'built', 'bare', 'snow_and_ice'
    ];

// 选择所有的概率段。
var dwTimeSeries = dw.select(probabilityBands);

// 绘制北京市的时间序列。
var chart = ui.Chart.image.series({
  imageCollection: dwTimeSeries,
  region: geometry,
  scale: 1000,
  //maxPixels:1e13这里设定最大像素值是无法实现的,减小研究区或者设法放款scale
});
print(chart);

// 重新定义我们的chart,然后我们对比查看两者的区别

// 一个辅助函数,用于为图表中的9个系列中的每个系列设置标签、颜色和样式属性。
function lineStyle(label, color) {
  var style_dict = {
      labelInLegend: label,
      color: color,
      lineWidth: 2,
      pointSize: 3
  };
  return style_dict;
}

// 我们现在创建图表,用配置选项的字典调用setOptions。
var chart = ui.Chart.image.series({
  imageCollection: dwTimeSeries,
  region: geometry,
  scale: 1000,

}).setOptions({
  vAxis: {
    title: 'Class probabilities',
    viewWindow: {min: 0, max: 1}},
  interpolateNulls: true,
  series: {
              0: lineStyle('Bare', '#A59B8F'),
              1: lineStyle('Built', '#C4281B'),
              2: lineStyle('Crops', '#E49635'),
              3: lineStyle('Flooded_vegetation', '#7A87C6'),
              4: lineStyle('Grass', '#88B053'),
              5: lineStyle('Shrub and scrub', '#DFC35A'),
              6: lineStyle('Snow and ice', '#B39FE1'),
              7: lineStyle('Trees', '#397D49'),
              8: lineStyle('Water', '#419BDF')}
});
print(chart);
原始的时间序列:

这个没有设置title和y轴的标题
alibaba/Sentinel: Sentinel 是阿里巴巴开源的一款面向分布式服务架构的流量控制、熔断降级组件,提供实时监控、限流、降级和系统保护功能,适用于微服务治理场景。
最近提交(Master分支:2 个月前 )
195150bc
* fix issue 2485 which occur oom when using async servlet request.
* optimize imports
* 1. fix the same issue in the webmvc-v6x
2. improve based on review comments 2 个月前
b78b09d3
2 个月前
更多推荐
 已为社区贡献6条内容


所有评论(0)