
YOLOV5学习笔记(八)——可视化任意特征层
yolov5
yolov5 - Ultralytics YOLOv8的前身,是一个用于目标检测、图像分割和图像分类任务的先进模型。
项目地址:https://gitcode.com/gh_mirrors/yo/yolov5
·
神经网络是一个黑盒子的概念,能够让特征层可视化,对网络的更改有很大的作用。
博主创建了一个科研互助群Q:950440005,欢迎大家加入讨论。

1、添加可视化函数
在units/plots.py文件中加载如下函数
import matplotlib.pyplot as plt
from torchvision import transforms
def feature_visualization2(features, model_type, model_id, feature_num=64,row=8,col=8):
    """
    features: The feature map which you need to visualization
    model_type: The type of feature map
    model_id: The id of feature map
    feature_num: The amount of visualization you need
    """
    save_dir = "features/"
    if not os.path.exists(save_dir):
        os.makedirs(save_dir)

    # print(features.shape)
    # block by channel dimension
    blocks = torch.chunk(features, features.shape[1], dim=1)

    # # size of feature
    # size = features.shape[2], features.shape[3]

    plt.figure()
    for i in range(feature_num):
        torch.squeeze(blocks[i])
        feature = transforms.ToPILImage()(blocks[i].squeeze())
        # print(feature)
        ax = plt.subplot(row, col, i+1)
        #ax = plt.subplot(int(math.sqrt(feature_num)), int(math.sqrt(feature_num)), i+1) #前两个参数m,n决定了将画布分为mn块第三个参数决定了当前选中画布的编号
        ax.set_xticks([])
        ax.set_yticks([])

        plt.imshow(feature)
        # gray feature
        # plt.imshow(feature, cmap='gray')

    # plt.show()
    plt.savefig(save_dir + '{}_{}_feature_map_{}.png'
                .format(model_type.split('.')[2], model_id, feature_num), dpi=300)
2、调用函数
在models/yolo.py文件中将_forward_once函数最后加上可视化选项
在文件开头引入相应的头文件
from utils.plots import feature_visualization2
    #输入经过网络每一层
    def _forward_once(self, x, profile=False, visualize=False):
        y, dt = [], []  # outputs
        for m in self.model:
            if m.f != -1:  # if not from previous layer
                x = y[m.f] if isinstance(m.f, int) else [x if j == -1 else y[j] for j in m.f]  # from earlier layers
            if profile:
                self._profile_one_layer(m, x, dt)
            x = m(x)  # run
            y.append(x if m.i in self.save else None)  # save output
            if visualize:
                feature_visualization(x, m.type, m.i, save_dir=visualize)

            feature_vis = True
            if m.type == 'models.common.C3' and feature_vis and m.i==17:
                print(m.type, m.i)
                feature_visualization2(x, m.type, m.i,128,8,16)
        return x
参数说明
models.common.C3:是层的名称
m.i:是层数
feature_vis:是否可视化
feature_visualization2(x, m.type, m.i,128,8,16):128是该层输出的通道数,8,16是生成特征图所有通道的行列。
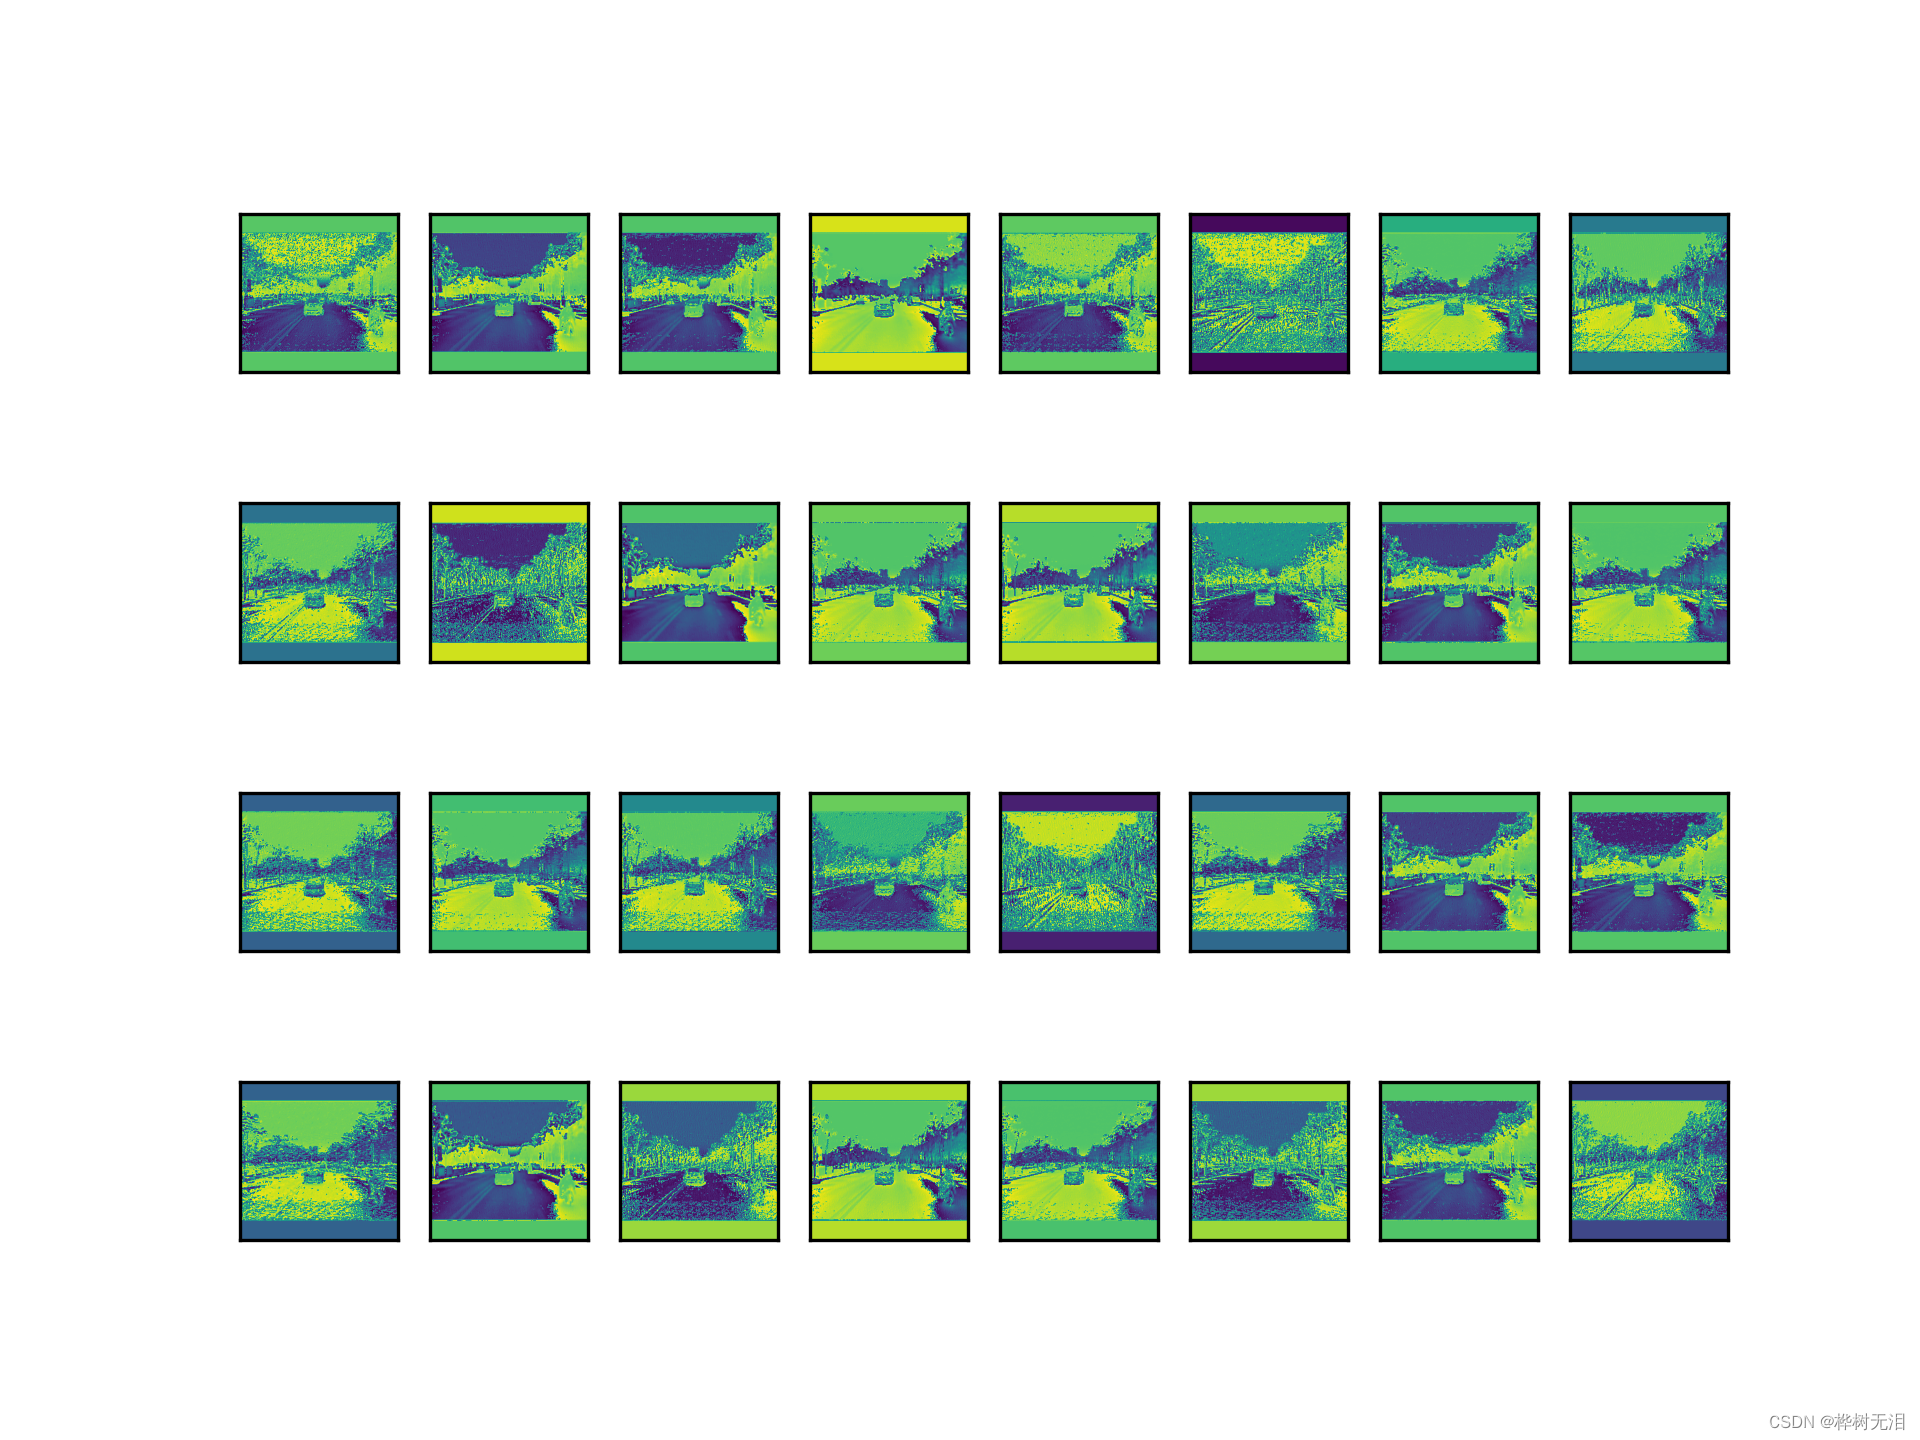
3、运行例子
例如我要运行第17层,则输出通道是128,名称是C3,取通道的排列是8×16

输入命令,注意batch-size设为1比较好观察,生成特征图如下
python train.py --data data/dual.yaml --cfg models/yolov5s.yaml --weights weights/yolov5s.pt --batch-size 1 --epochs 10
yolov5 - Ultralytics YOLOv8的前身,是一个用于目标检测、图像分割和图像分类任务的先进模型。
最近提交(Master分支:2 个月前 )
6981c274
Refactor code for speed and clarity
Co-authored-by: UltralyticsAssistant <web@ultralytics.com> 1 个月前
f003c3df
This commit resolves an issue where the save-csv command did not write the CSV header. The code now correctly saves the header in the CSV file.
Signed-off-by: Ali Ghanbari <alighanbari446@gmail.com>
Co-authored-by: Glenn Jocher <glenn.jocher@ultralytics.com> 1 个月前

旨在为数千万中国开发者提供一个无缝且高效的云端环境,以支持学习、使用和贡献开源项目。
更多推荐


 5
5 0
0- 0


 已为社区贡献6条内容

所有评论(0)