手机浏览器devtools_浏览器DevTools概述
手机浏览器devtools
浏览器开发工具 (The Browser DevTools)
I don’t think there was a time where websites and web applications were easy to build, as for backend technologies, but client-side development was surely easier than now, generally speaking.
我认为,就后端技术而言,没有一个网站和Web应用程序易于构建的时代,但是从总体上来说,客户端开发肯定比现在容易。
Once you figured out the differences between Internet Explored and Netscape Navigator, and avoided the proprietary tags and technology, all you had to use was HTML and later CSS.
一旦弄清了Internet Explore和Netscape Navigator之间的区别,并且避免了专有标签和技术,您只需要使用HTML和更高版本CSS。
JavaScript was a tech for creating dialog boxes and a little bit more, but was definitely not as pervasive as today.
JavaScript是一种用于创建对话框的技术,但它的功能还远远不如今天。
Although lots of web pages are still plain HTML + CSS, like this page, many other websites are real applications that run in the browser.
尽管许多网页仍是纯HTML + CSS,但与此网页一样,许多其他网站都是在浏览器中运行的真实应用程序。
Just providing the source of the page, like browser did once upon a time, was not enough.
仅仅提供页面源(就像浏览器曾经一样)是远远不够的。
Browser had to provide much more information on how they rendered the page, and what the page is currently doing, hence they introduced a feature for developers: their developer tools.
浏览器必须提供有关如何呈现页面以及页面当前正在做什么的更多信息,因此他们为开发人员引入了一项功能 : 开发人员工具 。
Every browser is different and so their dev tools are slightly different. At the time of writing my favorite developer tools are provided by Chrome, and this is the browser we’ll talk here, although also Firefox and Edge have great tools as well.
每个浏览器都不同,因此它们的开发工具也略有不同。 在撰写本文时,Chrome提供了我最喜欢的开发人员工具,这是我们将在这里讨论的浏览器,尽管Firefox和Edge也具有出色的工具。
HTML结构和CSS (HTML Structure and CSS)
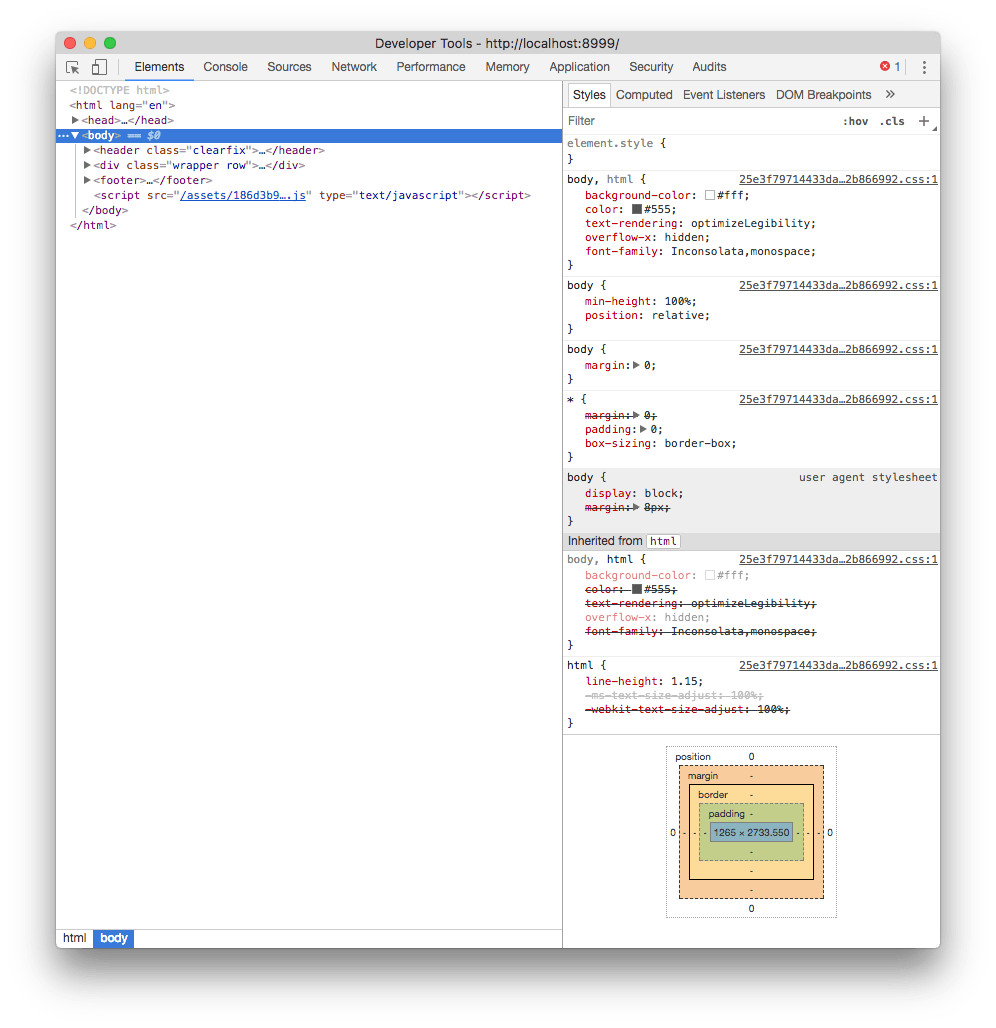
The most basic form of usage, and a very common one, is inspecting the content of a webpage. When you open the DevTools that’s the panel the Elements panel is what you see:
使用的最基本形式(也是最常见的形式)是检查网页的内容。 当您打开面板的DevTools时,您将看到“元素”面板:
HTML面板 (The HTML panel)
On the left, the HTML that composes the page.
左侧是组成页面HTML。
Hovering the elements in the HTML panel highlights the element in the page, and clicking the first icon in the toolbar allows you to click an element in the page, and analyze it in the inspector.
将鼠标悬停在HTML面板中的元素上将突出显示页面中的元素,单击工具栏上的第一个图标可让您单击页面中的元素,并在检查器中对其进行分析。
You can drag and drop elements in the inspector to live change their positioning in the page.
您可以在检查器中拖放元素以实时更改其在页面中的位置。
CSS样式面板 (The CSS styles panel)
On the right, the CSS styles that are applied to the currently selected element.
在右侧,应用于当前选定元素CSS样式。
In addition to editing and disabling properties, you can add a new CSS property, with any target you want, by clicking the + icon.
除了编辑和禁用属性外,还可以通过单击+图标添加具有所需任何目标的新CSS属性。
Also you can trigger a state for the selected element, so you can see the styles applied when it’s active, hovered, on focus.
另外,您可以触发所选元素的状态,因此您可以查看处于活动状态,悬停在焦点上时应用的样式。
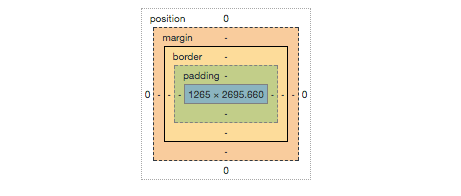
At the bottom, the box model of the selected element helps you figure out margins, paddings, border and dimensions at a quick glance:
在底部,选定元素的框模型可帮助您快速浏览边距,填充,边框和尺寸:
控制台 (The Console)
The second most important element of the DevTools is the Console.
DevTools的第二个最重要的元素是控制台。
The Console can be seen on its own panel, or by pressing Esc in the Elements panel, it will show up in the bottom.
可以在自己的面板上看到控制台,或者在Elements面板中按Esc ,它将显示在底部。
The Console serves mainly two purposes: executing custom JavaScript and error reporting.
控制台主要用于两个目的: 执行自定义JavaScript和错误报告 。
执行自定义JavaScript (Executing custom JavaScript)
At the bottom of the Console there is a blinking cursor. You can type any JavaScript there, and it will be promptly executed. As an example, try running:
在控制台的底部,有一个闪烁的光标。 您可以在此处键入任何JavaScript,它将立即执行。 例如,尝试运行:
alert('test')The special identifier $0 allows you to reference the element currently selected in the elements inspector. If you want to reference that as a jQuery selector, use $($0).
特殊标识符$0允许您引用元素检查器中当前选择的元素。 如果要引用它作为jQuery选择器,请使用$($0) 。
You can write more than one line with shift-enter. Pressing enter at the end of the script runs it.
您可以使用shift-enter编写多行内容。 在脚本末尾按Enter即可运行它。
错误报告 (Error reporting)
Any error, warning or information that happens while rendering the page, and subsequently executing the JavaScript, is listed here.
此处列出了呈现页面并随后执行JavaScript时发生的任何错误,警告或信息。
For example failing to load a resource from the network, with information on why, is reported in the console.
例如,控制台中报告了未能从网络加载资源以及有关为什么的信息。

In this case, clicking the resource URL brings you to the Network panel, showing more info which you can use to determine the cause of the problem.
在这种情况下,单击资源URL会将您带到“网络”面板,其中显示更多信息,您可以使用这些信息来确定问题的原因。
You can filter those messages by level (Error / Warning / Info) and also filter them by content.
您可以按级别(错误/警告/信息)过滤这些消息,也可以按内容过滤它们。
Those messages can be user-generated in your own JavaScript by using the Console API:
这些消息可以使用Console API在用户自己JavaScript中由用户生成:
console.log('Some info message')
console.warn('Some warning message')
console.error('Some error message')
模拟器 (The emulator)
The Chrome DevTools embed a very useful device emulator which you can use to visualize your page in every device size you want.
Chrome DevTools嵌入了一个非常有用的设备仿真器,您可以使用该仿真器以所需的每种设备尺寸可视化页面。
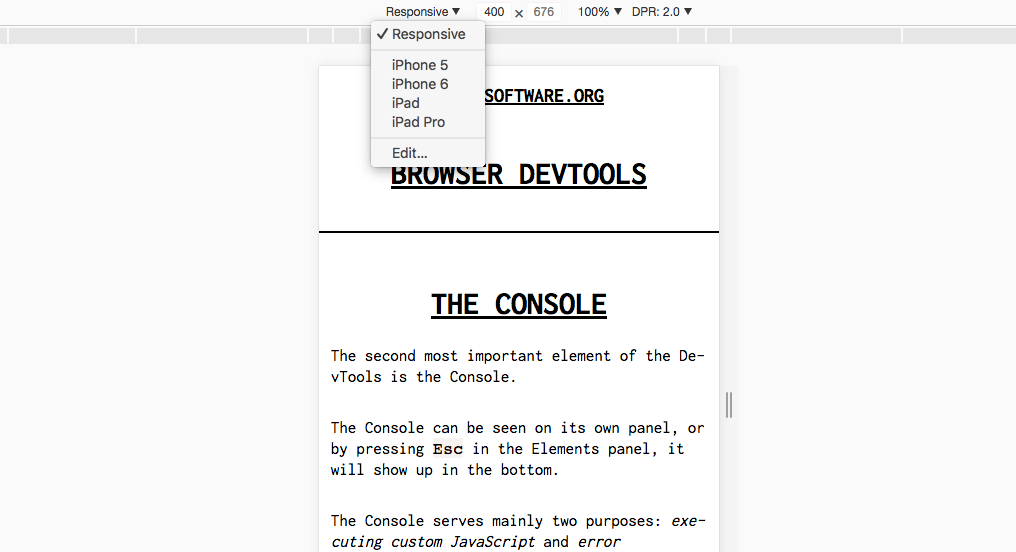
You can choose from the presets the most popular mobile devices, including iPhones, iPads, Android devices and much more, or specify the pixel dimensions yourself, and the screen definition (1x, 2x retina, 3x retina HD).
您可以从预设中选择最受欢迎的移动设备,包括iPhone,iPad,Android设备等等,也可以自己指定像素尺寸以及屏幕清晰度(1倍,2倍视网膜,3倍视网膜HD)。
In the same panel you can setup network throttling for that specific Chrome tab, to emulate a low speed connection and see how the page loads, and the “show media queries” option shows you how media queries modify the CSS of the page.
在同一面板中,您可以为特定的Chrome标签设置网络限制 ,以模拟低速连接并查看页面的加载方式,“ 显示媒体查询 ”选项显示媒体查询如何修改页面CSS。
网络面板 (The network panel)
The Network Panel of the DevTools allows you to see all the connections that the browser must process while rendering a page.
DevTools的网络面板允许您查看呈现页面时浏览器必须处理的所有连接。

At a quick glance the page shows:
快速浏览页面显示:
- a toolbar where you can setup some options and filters 工具栏,您可以在其中设置一些选项和过滤器
- a loading graph of the page as a whole 整个页面的加载图
- every single request, with HTTP method, response code, size and other details 每个请求,带有HTTP方法,响应代码,大小和其他详细信息
- a footer with the summary of the total requests, the total size of the page and some timing indications. 页脚,其中包含总请求摘要,页面总大小以及一些时间指示。
A very useful option in the toolbar is preserve log. By enabling it, you can move to another page, and the logs will not be cleared.
工具栏中的一个非常有用的选项是保留日志 。 通过启用它,您可以移至另一页,并且不会清除日志。
Another very useful tool to track loading time is disable cache. This can be enabled globally in the DevTools settings as well, to always disable cache when DevTools is open.
跟踪加载时间的另一个非常有用的工具是禁用缓存 。 也可以在DevTools设置中全局启用此功能,以在打开DevTools时始终禁用缓存。
Clicking a specific request in the list shows up the detail panel, with HTTP Headers report:
单击列表中的特定请求将显示详细信息面板,其中包含HTTP标头报告:

And the loading time breakdown:
以及加载时间明细:

JavaScript调试器 (JavaScript debugger)
If you click an error message in the DevTools Console, the Sources tab opens and in addition to pointing you to the file and line where the error happened, you have the option to use the JavaScript debugger.
如果您在DevTools控制台中单击错误消息,则会打开“源”选项卡,除了将您指向发生错误的文件和行之外,您还可以选择使用JavaScript调试器。
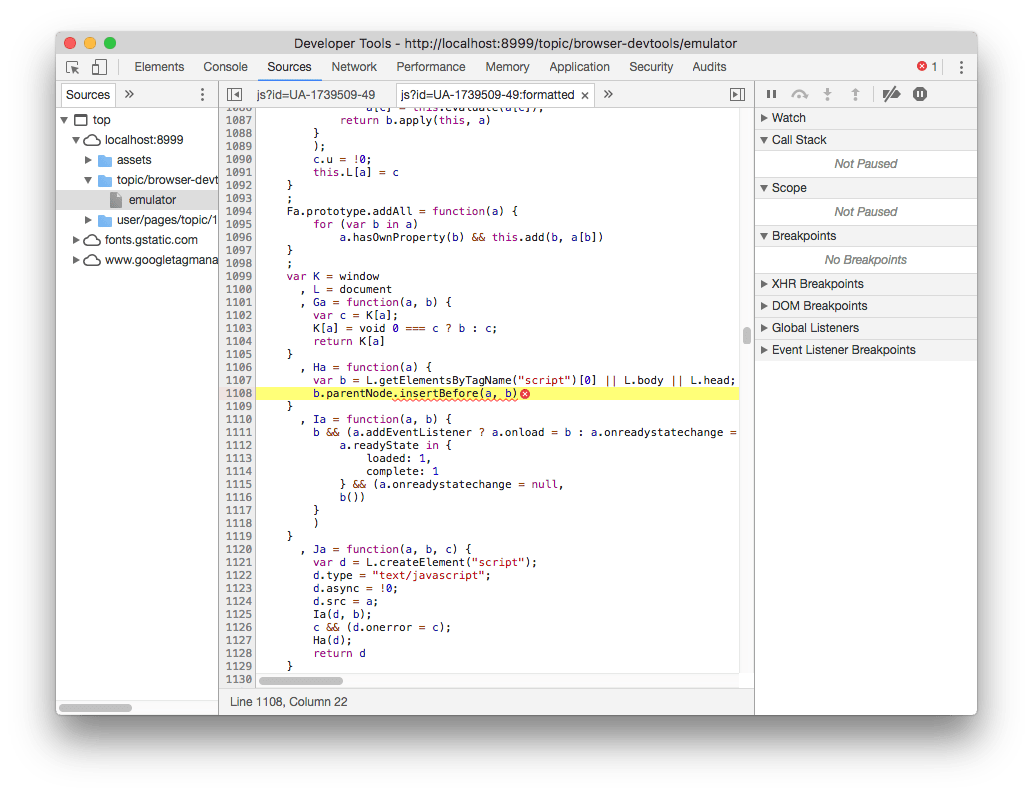
This is a full-featured debugger. You can set breakpoints, watch variables, and listen to DOM changes or break on specific XHR (AJAX) network requests, or event listeners.
这是功能齐全的调试器。 您可以设置断点,监视变量,侦听DOM更改或在特定XHR (AJAX)网络请求或事件侦听器上中断。
应用与储存 (Application and Storage)
The Application tab gives you lots of information about which information is stored inside the browser relative to your website.
“应用程序”选项卡为您提供了许多信息,这些信息与哪些信息相对于您的网站存储在浏览器中有关。

存储 (Storage)
You gain access to detailed reports and tools to interact with the application storage:
您可以访问与应用程序存储交互的详细报告和工具:
and you can quickly wipe any information, to start with a clean slate.
您可以快速擦除所有信息,从头开始。
应用 (Application)
This tab also gives you tools to inspect and debug Progressive Web Apps.
此选项卡还为您提供了检查和调试Progressive Web Apps的工具。
Click manifest to get information about the web app manifest, used to allow mobile users to add the app to their home, and simulate the “add to homescreen” events.
单击清单以获取有关Web应用清单的信息,该清单用于允许移动用户将应用添加到他们的家中,并模拟“添加到主屏幕”事件。
Service workers let you inspect your application service workers. If you don’t know what service workers are, in short they are a fundamental technology that powers modern web apps, to provide features like notification, capability to run offline and synchronize across devices.
服务人员可让您检查应用程序服务人员。 如果您不知道服务人员是什么,简而言之,它们是为现代Web应用程序提供动力的一项基本技术,可提供通知,脱机运行以及跨设备同步等功能。
安全标签 (Security tab)
The Security tab gives you all the information that the browser has relatively to the security of the connection to the website.
“安全性”选项卡为您提供浏览器相对于网站连接安全性的所有信息。

If there is any problem with the HTTPS connection, if the site is served over TLS, it will provide you more information about what’s causing it.
如果HTTPS连接有任何问题,如果该站点通过TLS提供服务,它将为您提供有关造成该问题的原因的更多信息。
审核 (Audits)
The Audits tab will help you find and solve some issues relative to performance and in general the quality of the experience that users have when accessing your website.
“审核”选项卡将帮助您发现和解决一些与性能有关的问题,这些问题通常与用户访问您的网站时的体验质量有关。
You can perform various kinds of audits depending on the kind of website:
您可以根据网站的类型执行各种审核:
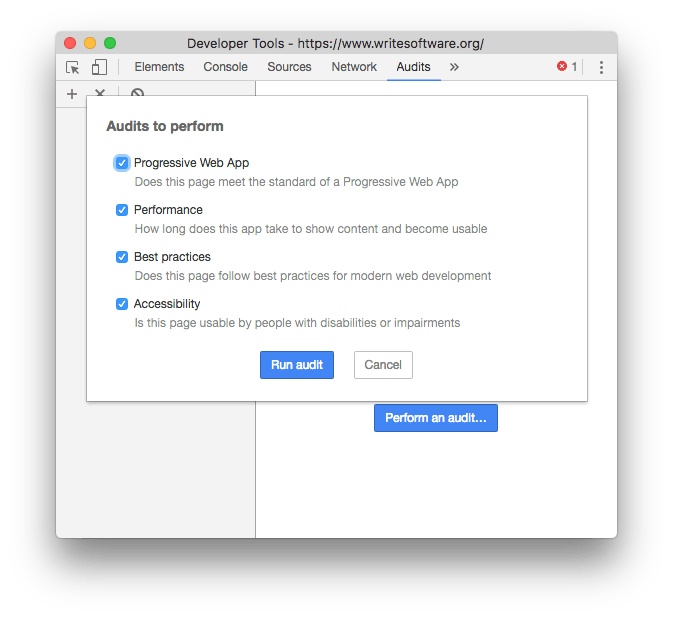
The audit is provided by Lighthouse, an open source automated website quality check tool. It takes a while to run, then it provides you a very nice report with key actions to check.
审核由Lighthouse (一种开源的自动化网站质量检查工具)提供。 它需要一段时间才能运行,然后为您提供了非常不错的报告,其中包含要检查的关键操作。

If you want to know more about the Chrome DevTools, check out this Chrome DevTools Tips list 😀
如果您想进一步了解Chrome DevTools,请查看此Chrome DevTools提示列表 😀
手机浏览器devtools
更多推荐
 已为社区贡献1条内容


所有评论(0)