echarts实现3D饼图
·
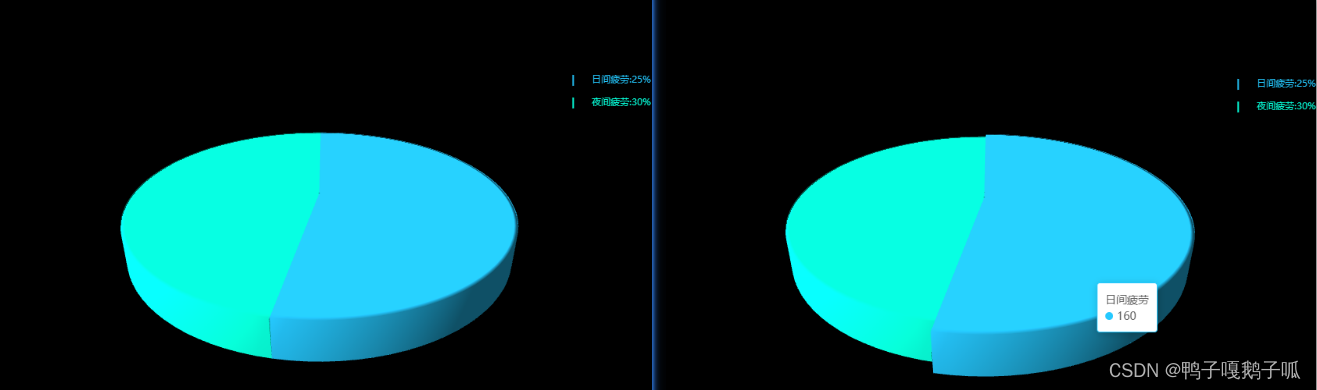
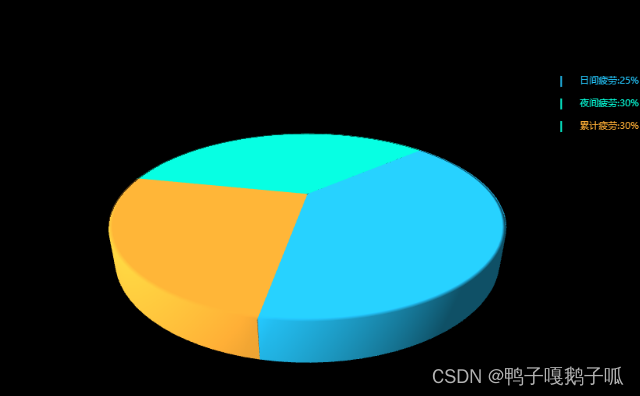
1,效果图
2,要实现3D效果,除了echarts还需要echarts-gl,请注意:echarts与echarts-gl是有版本对应的,
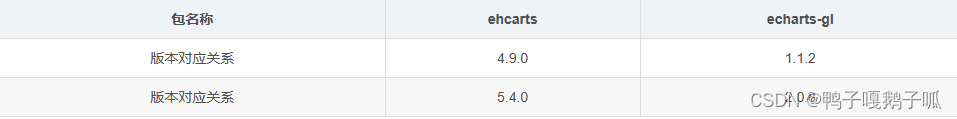
本代码echarts版本是5.50,echarts-gl版本是2.0.9
![]()
3:代码实现
<template>
    <div class="container">
        <div id="chartsContent" style="width:860px;height:550px;"></div>
    </div>

</template>

<script setup>
import { getCurrentInstance, onMounted, inject } from 'vue';
import 'echarts-gl'
// 通过 internalInstance.appContext.config.globalProperties 获取全局属性或方法
let internalInstance = getCurrentInstance();
let echarts = internalInstance.appContext.config.globalProperties.$echarts;

onMounted(() => {
    var myChart = echarts.init(document.getElementById('chartsContent'));
    // 生成扇形的曲面参数方程,用于 series-surface.parametricEquation
    let selectedIndex = '';
    let hoveredIndex = '';
    let option = getPie3D(
        [
            {
                name: '日间疲劳',
                value: 160,
                itemStyle: {
                    color: '#25C9FF'
                },
            },
            {
                name: '夜间疲劳',
                value: 144,
                itemStyle: {
                    color: '#07FFDA'
                },
            },
            {
                name: '累计疲劳',
                value: 104,
                itemStyle: {
                    color: '#FFAF36'
                },
            },

        ],
        0
    );
    let dataSource = [{
        name: "日间疲劳",
        value: 25,
    },
    {
        name: "夜间疲劳",
        value: 30,
    },
    {
        name: "累计疲劳",
        value: 30,
    },
    ]
    // 生成扇形的曲面参数方程
    function getParametricEquation(startRatio, endRatio, isSelected, isHovered, k, h) {
        // 计算
        const midRatio = (startRatio + endRatio) / 2;

        const startRadian = startRatio * Math.PI * 2;
        const endRadian = endRatio * Math.PI * 2;
        const midRadian = midRatio * Math.PI * 2;

        // 如果只有一个扇形,则不实现选中效果。
        if (startRatio === 0 && endRatio === 1) {
            // eslint-disable-next-line no-param-reassign
            isSelected = false;
        }

        // 通过扇形内径/外径的值,换算出辅助参数 k(默认值 1/3)
        // eslint-disable-next-line no-param-reassign
        k = typeof k !== 'undefined' ? k : 1 / 3;

        // 计算选中效果分别在 x 轴、y 轴方向上的位移(未选中,则位移均为 0)
        const offsetX = isSelected ? Math.cos(midRadian) * 0.1 : 0;
        const offsetY = isSelected ? Math.sin(midRadian) * 0.1 : 0;

        // 计算高亮效果的放大比例(未高亮,则比例为 1)
        const hoverRate = isHovered ? 1.05 : 1;

        // 返回曲面参数方程
        return {
            u: {
                min: -Math.PI,
                // min: 0,
                max: Math.PI * 3,
                step: Math.PI / 50,
            },

            v: {
                min: 0,
                max: Math.PI * 2,
                step: Math.PI / 20,
            },

            x(u, v) {
                if (u < startRadian) {
                    return offsetX + Math.cos(startRadian) * (1 + Math.cos(v) * k) * hoverRate;
                }
                if (u > endRadian) {
                    return offsetX + Math.cos(endRadian) * (1 + Math.cos(v) * k) * hoverRate;
                }
                return offsetX + Math.cos(u) * (1 + Math.cos(v) * k) * hoverRate;
            },

            y(u, v) {
                if (u < startRadian) {
                    return offsetY + Math.sin(startRadian) * (1 + Math.cos(v) * k) * hoverRate;
                }
                if (u > endRadian) {
                    return offsetY + Math.sin(endRadian) * (1 + Math.cos(v) * k) * hoverRate;
                }
                return offsetY + Math.sin(u) * (1 + Math.cos(v) * k) * hoverRate;
            },

            z(u, v) {
                if (u < -Math.PI * 0.5) {
                    return Math.sin(u);
                }
                if (u > Math.PI * 2.5) {
                    return Math.sin(u) * h * 0.1;
                }
                // 当前图形的高度是Z根据h(每个value的值决定的)
                return Math.sin(v) > 0 ? 1 * h * 0.1 : -1;
            },
        };
    }
    // 生成模拟 3D 饼图的配置项
    function getPie3D(pieData, internalDiameterRatio) {
        const series = [];
        // 总和
        let sumValue = 0;
        let startValue = 0;
        let endValue = 0;
        const legendData = [];
        const k =
            typeof internalDiameterRatio !== 'undefined'
                ? (1 - internalDiameterRatio) / (1 + internalDiameterRatio)
                : 1 / 3;

        // 为每一个饼图数据,生成一个 series-surface 配置
        for (let i = 0; i < pieData.length; i += 1) {
            sumValue += pieData[i].value;

            const seriesItem = {
                name: typeof pieData[i].name === 'undefined' ? `series${i}` : pieData[i].name,
                type: 'surface',
                parametric: true,
                wireframe: {
                    show: false,
                },
                pieData: pieData[i],
                pieStatus: {
                    selected: false,
                    hovered: false,
                    k
                }

            };

            if (typeof pieData[i].itemStyle !== 'undefined') {
                const { itemStyle } = pieData[i];

                // eslint-disable-next-line no-unused-expressions
                typeof pieData[i].itemStyle.color !== 'undefined' ? (itemStyle.color = pieData[i].itemStyle.color) : null;
                // eslint-disable-next-line no-unused-expressions
                typeof pieData[i].itemStyle.opacity !== 'undefined'
                    ? (itemStyle.opacity = pieData[i].itemStyle.opacity)
                    : null;

                seriesItem.itemStyle = itemStyle;
            }
            series.push(seriesItem);
        }
        // 使用上一次遍历时,计算出的数据和 sumValue,调用 getParametricEquation 函数,
        // 向每个 series-surface 传入不同的参数方程 series-surface.parametricEquation,也就是实现每一个扇形。
        console.log(series);
        for (let i = 0; i < series.length; i += 1) {
            endValue = startValue + series[i].pieData.value;

            series[i].pieData.startRatio = startValue / sumValue;
            series[i].pieData.endRatio = endValue / sumValue;
            series[i].parametricEquation = getParametricEquation(
                series[i].pieData.startRatio,
                series[i].pieData.endRatio,
                false,
                false,
                k,
                // 我这里做了一个处理,使除了第一个之外的值都是10
                // series[i].pieData.value === series[0].pieData.value ? 35 : 10
                8.8
            );

            startValue = endValue;

            legendData.push(series[i].name);
        }

        // 准备待返回的配置项,把准备好的 legendData、series 传入。
        const option = {
            // animation: false,
            tooltip: {
                formatter: (params) => {
                    if (params.seriesName !== 'mouseoutSeries') {
                        return `${params.seriesName
                            }<br/><span style="display:inline-block;margin-right:5px;border-radius:10px;width:10px;height:10px;background-color:${params.color
                            };"></span>${option.series[params.seriesIndex].pieData.value}`;
                    }
                    return '';
                },
            },
            legend: {
                show: true,
                itemGap: 15,
                // data: ['10%以内:25%', '10%-20%:25%','20%-30%:25%','30%以上:25%'],
                orient: 'vertical',
                right: '0px',
                top: '100px',
                itemWidth: '2',
                data: [
                    { name: '日间疲劳', textStyle: { width: '10', color: '#25C9FF', textShadowOffsetX: 200 }, itemStyle: { color: '#23C0F4' } },
                    { name: '夜间疲劳', textStyle: { width: '20', color: '#07FFDA' }, itemStyle: { color: '#07FFDA' } },
                    { name: '累计疲劳', textStyle: { width: '20', color: '#FFAF36' }, itemStyle: { color: '#07FFDA' } },

                ],
                formatter(name) {
                    var tarValue;
                    for (var i = 0; i < dataSource.length; i++) {
                        if (dataSource[i].name == name) {
                            tarValue = dataSource[i].value;
                        }
                    }
                    var v = tarValue;

                    return [
                        `${name}:`,
                        `${v}%`,
                    ].join("");
                }
            },
            xAxis3D: {
                min: -1,
                max: 1,
            },
            yAxis3D: {
                min: -1,
                max: 1,
            },
            zAxis3D: {
                min: -1,
                max: 1,
            },
            grid3D: {
                show: false,
                boxHeight: 20,
                top: 0,
                viewControl: {
                    // 3d效果可以放大、旋转等,请自己去查看官方配置
                    alpha: 28,
                    beta: 100,
                    rotateSensitivity: 0,
                    zoomSensitivity: 0,
                    panSensitivity: 0,
                    autoRotate: false,
                    distance: 250,
                },
                light: {
                    main: {
                        color: "rgb( 255, 255,255)", // 主光源的颜色。
                        shadow: false, // 主光源是否投射阴影
                        alpha: 40, // 主光源绕 x 轴,即上下旋转的角度
                    },
                },
                // 后处理特效可以为画面添加高光、景深、环境光遮蔽(SSAO)、调色等效果。可以让整个画面更富有质感。
                // postEffect: {
                //     // 配置这项会出现锯齿,请自己去查看官方配置有办法解决
                //     enable: false,
                //     bloom: {
                //         enable: true,
                //         bloomIntensity: 0.8,
                //     },
                //     SSAO: {
                //         enable: true,
                //         quality: 'medium',
                //         radius: 5,
                //     },
                //     // temporalSuperSampling: {
                //     //   enable: true,
                //     // },
                // },
            },
            series: series,
        };
        return option;
    }
    //  修正取消高亮失败的 bug
    // 监听 mouseover,近似实现高亮(放大)效果
    myChart.on('mouseover', function (params) {
        // 准备重新渲染扇形所需的参数
        let isSelected;
        let isHovered;
        let startRatio;
        let endRatio;
        let k;
        let i;

        // 如果触发 mouseover 的扇形当前已高亮,则不做操作
        if (hoveredIndex === params.seriesIndex) {
            return;

            // 否则进行高亮及必要的取消高亮操作
        } else {
            // 如果当前有高亮的扇形,取消其高亮状态(对 option 更新)
            if (hoveredIndex !== '') {
                // 从 option.series 中读取重新渲染扇形所需的参数,将是否高亮设置为 false。
                isSelected = option.series[hoveredIndex].pieStatus.selected;
                isHovered = false;
                startRatio = option.series[hoveredIndex].pieData.startRatio;
                endRatio = option.series[hoveredIndex].pieData.endRatio;
                k = option.series[hoveredIndex].pieStatus.k;
                i = option.series[hoveredIndex].pieData.value === option.series[0].pieData.value ? 35 : 10;
                // 对当前点击的扇形,执行取消高亮操作(对 option 更新)
                option.series[hoveredIndex].parametricEquation = getParametricEquation(
                    startRatio,
                    endRatio,
                    isSelected,
                    isHovered,
                    k,
                    // i
                    8.8
                );
                option.series[hoveredIndex].pieStatus.hovered = isHovered;

                // 将此前记录的上次选中的扇形对应的系列号 seriesIndex 清空
                hoveredIndex = '';
            }

            // 如果触发 mouseover 的扇形不是透明圆环,将其高亮(对 option 更新)
            if (params.seriesName !== 'mouseoutSeries') {
                // 从 option.series 中读取重新渲染扇形所需的参数,将是否高亮设置为 true。
                isSelected = option.series[params.seriesIndex].pieStatus.selected;
                isHovered = true;
                startRatio = option.series[params.seriesIndex].pieData.startRatio;
                endRatio = option.series[params.seriesIndex].pieData.endRatio;
                k = option.series[params.seriesIndex].pieStatus.k;

                // 对当前点击的扇形,执行高亮操作(对 option 更新)
                option.series[params.seriesIndex].parametricEquation = getParametricEquation(
                    startRatio,
                    endRatio,
                    isSelected,
                    isHovered,
                    k,
                    // option.series[params.seriesIndex].pieData.value + 5
                    8.8
                );
                option.series[params.seriesIndex].pieStatus.hovered = isHovered;

                // 记录上次高亮的扇形对应的系列号 seriesIndex
                hoveredIndex = params.seriesIndex;
            }

            // 使用更新后的 option,渲染图表
            myChart.setOption(option);
        }
    });

    // 修正取消高亮失败的 bug
    myChart.on('globalout', function () {
        if (hoveredIndex !== '') {
            // 从 option.series 中读取重新渲染扇形所需的参数,将是否高亮设置为 true。
            let isSelected = option.series[hoveredIndex].pieStatus.selected;
            let isHovered = false;
            let k = option.series[hoveredIndex].pieStatus.k;
            let startRatio = option.series[hoveredIndex].pieData.startRatio;
            let endRatio = option.series[hoveredIndex].pieData.endRatio;
            // 对当前点击的扇形,执行取消高亮操作(对 option 更新)
            let i = option.series[hoveredIndex].pieData.value === option.series[0].pieData.value ? 35 : 10;
            option.series[hoveredIndex].parametricEquation = getParametricEquation(
                startRatio,
                endRatio,
                isSelected,
                isHovered,
                k,
                8.8
            );
            option.series[hoveredIndex].pieStatus.hovered = isHovered;

            // 将此前记录的上次选中的扇形对应的系列号 seriesIndex 清空
            hoveredIndex = '';
        }

        // 使用更新后的 option,渲染图表
        myChart.setOption(option);
    });
    myChart.setOption(option);


});


</script>
AtomGit 是由开放原子开源基金会联合 CSDN 等生态伙伴共同推出的新一代开源与人工智能协作平台。平台坚持“开放、中立、公益”的理念,把代码托管、模型共享、数据集托管、智能体开发体验和算力服务整合在一起,为开发者提供从开发、训练到部署的一站式体验。
更多推荐


 13
13 0
0- 0


 已为社区贡献2条内容

所有评论(0)