
Filebeat详细介绍,下载和启动,日志读取和模块设置等
Filebeat是一个轻量级的日志采集器当我们的元数据没办法支撑我们的业务时,我们还可以自定义添加一些字段tags: [ "web" , "test" ] #添加自定义tag,便于后续的处理 fields: #添加自定义字段 from: web-testfields_under_root: true #true为添加到根节点,false为添加到子节点中 setup.template.setting
目录
Filebeat
介绍
Filebeat是一个轻量级的日志采集器
为什么要用Filebeat?
当面对成百上千、甚至成千上万的服务器、虚拟机和容器生成的日志时,Filebeat可以提供一种轻量型方法,用于转发和汇总日志与文件,关于Filebeat的记住以下两点:
- 轻量级日志采集器
- 输送至ElasticSearch或者Logstash,在Kibana中实现可视化
架构
用于监控、收集服务器日志文件.
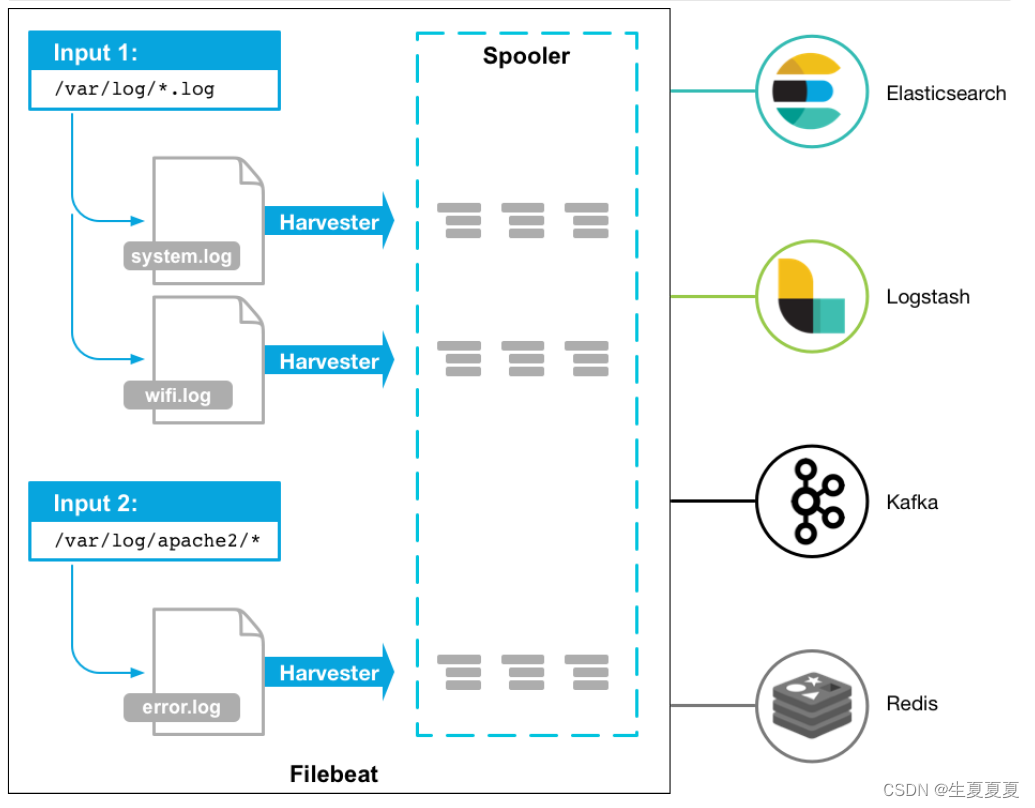
流程如下:
- 首先是input输入,可以指定多个数据输入源,然后通过通配符进行日志文件的匹配
- 匹配到日志后,就会使用Harvester(收割机),将日志源源不断的读取到来
- 然后收割机收割到的日志,就传递到Spooler(卷轴),然后卷轴就在将他们传到对应的地方
下载
可以直接wget下载
# 进入文件夹
cd /opt/elk/
# 下载
wget https://artifacts.elastic.co/downloads/beats/filebeat/filebeat-8.8.1-linux-x86_64.tar.gz
# 解压文件
tar -zxvf filebeat-8.8.1-linux-x86_64.tar.gz
# 重命名
mv filebeat-8.8.1-linux-x86_64  filebeat
然后进入到filebeat目录下,创建对应的配置文件
# 进入文件夹
cd filebeats
# 创建配置文件
vim shengxia.yml
添加如下内容
filebeat.inputs: # filebeat input输入
- type: stdin    # 标准输入
  enabled: true  # 启用标准输入
setup.template.settings:
  index.number_of_shards: 3 # 指定下载数
output.console:  # 控制台输出
  pretty: true   # 启用美化功能
  enable: true
启动
在我们添加完配置文件后,我们就可以对filebeat进行启动了
./filebeat -e -c shengxia.yml
然后我们在控制台输入hello,就能看到我们会有一个json的输出,是通过读取到我们控制台的内容后输出的,内容如下
{
  "@timestamp": "2023-05-31T22:57:58.700Z",
  "@metadata": {#元数据信息
    "beat": "filebeat",
    "type": "_doc",
    "version": "8.8.1"
  },
  "log": {
    "offset": 0,
    "file": {
      "path": ""
    }
  },
  "message": "hello",#元数据信息
  "input": {#控制台标准输入
    "type": "stdin"#元数据信息
  },
  "ecs": {
    "version": "8.0.0"
  },
  "host": {
    "name": "elk-node1"
  },
  "agent": {#版本以及主机信息
    "id": "5d5e4b99-8ee3-42f5-aae3-b0492d723730",
    "name": "elk-node1",
    "type": "filebeat",
    "version": "8.8.1",
    "ephemeral_id": "24b4fd16-5466-4d7e-b4b8-b73d41f77de0"
  }
}
读取文件
再次创建一个文件,叫 shengxia-log.yml,然后在文件里添加如下内容
filebeat.inputs:
- type: log
  enabled: true
  paths:
    - /opt/elk/logs/*.log
setup.template.settings:
  index.number_of_shards: 3
output.console:
  pretty: true
  enable: true
添加完成后,我们在到下面目录创建一个日志文件
# 创建文件夹
mkdir -p /opt/elk/logs

# 进入文件夹
cd /opt/elk/logs

# 追加内容
echo "hello world" >> test.log
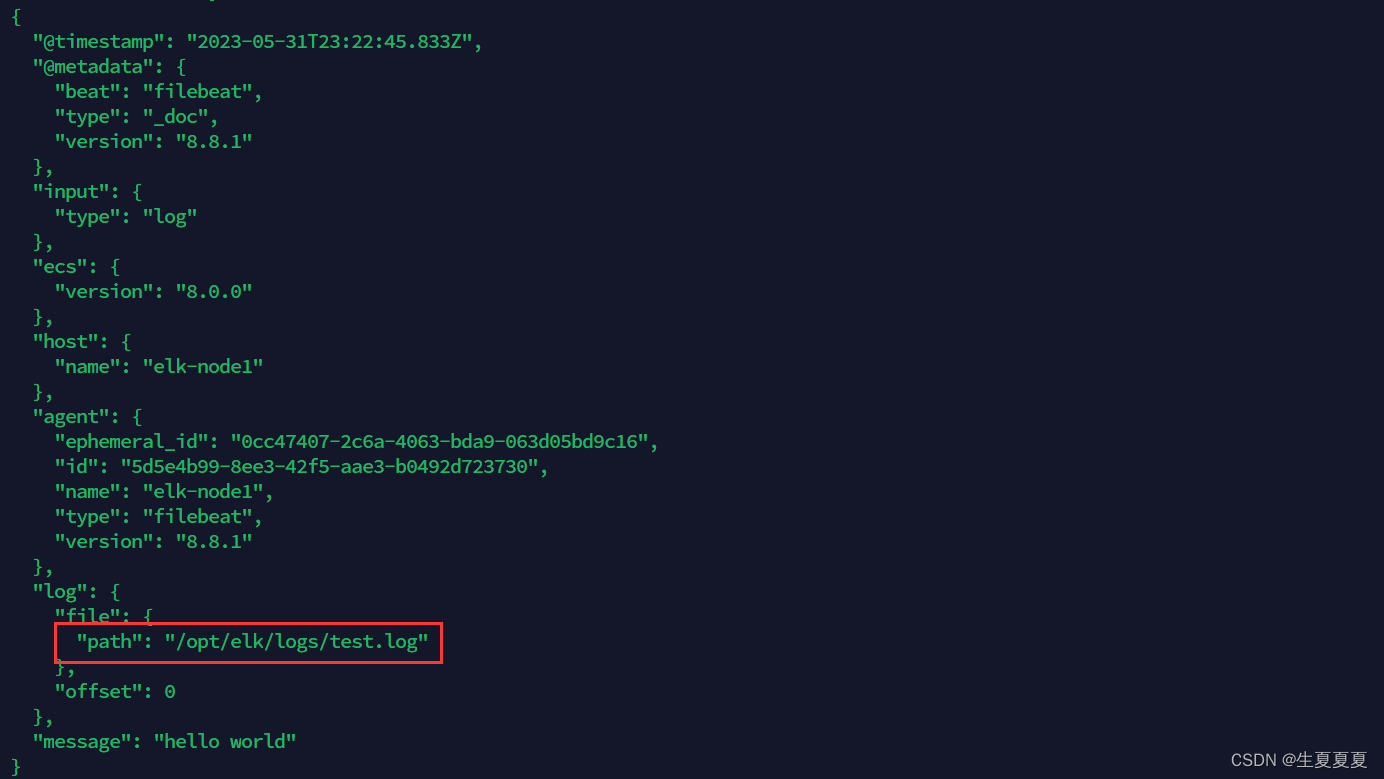
然后再次启动filebeat
./filebeat -e -c shengxia-log.yml
能够发现,它已经成功加载到了我们的日志文件 test.log
同时我们还可以继续往文件中追加内容
echo "are you ok ?" >> a.log
追加后,我们再次查看filebeat,也能看到刚刚我们追加的内容
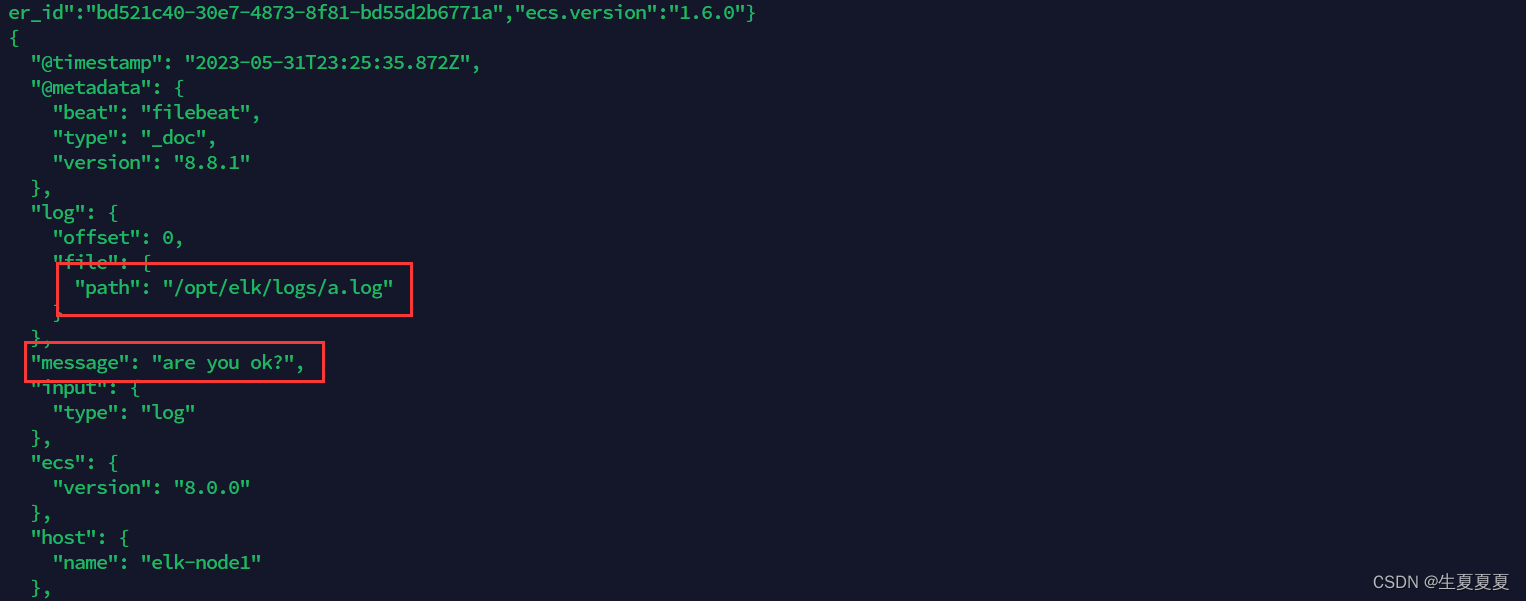
可以看出,已经检测到日志文件有更新,立刻就会读取到更新的内容,并且输出到控制台。
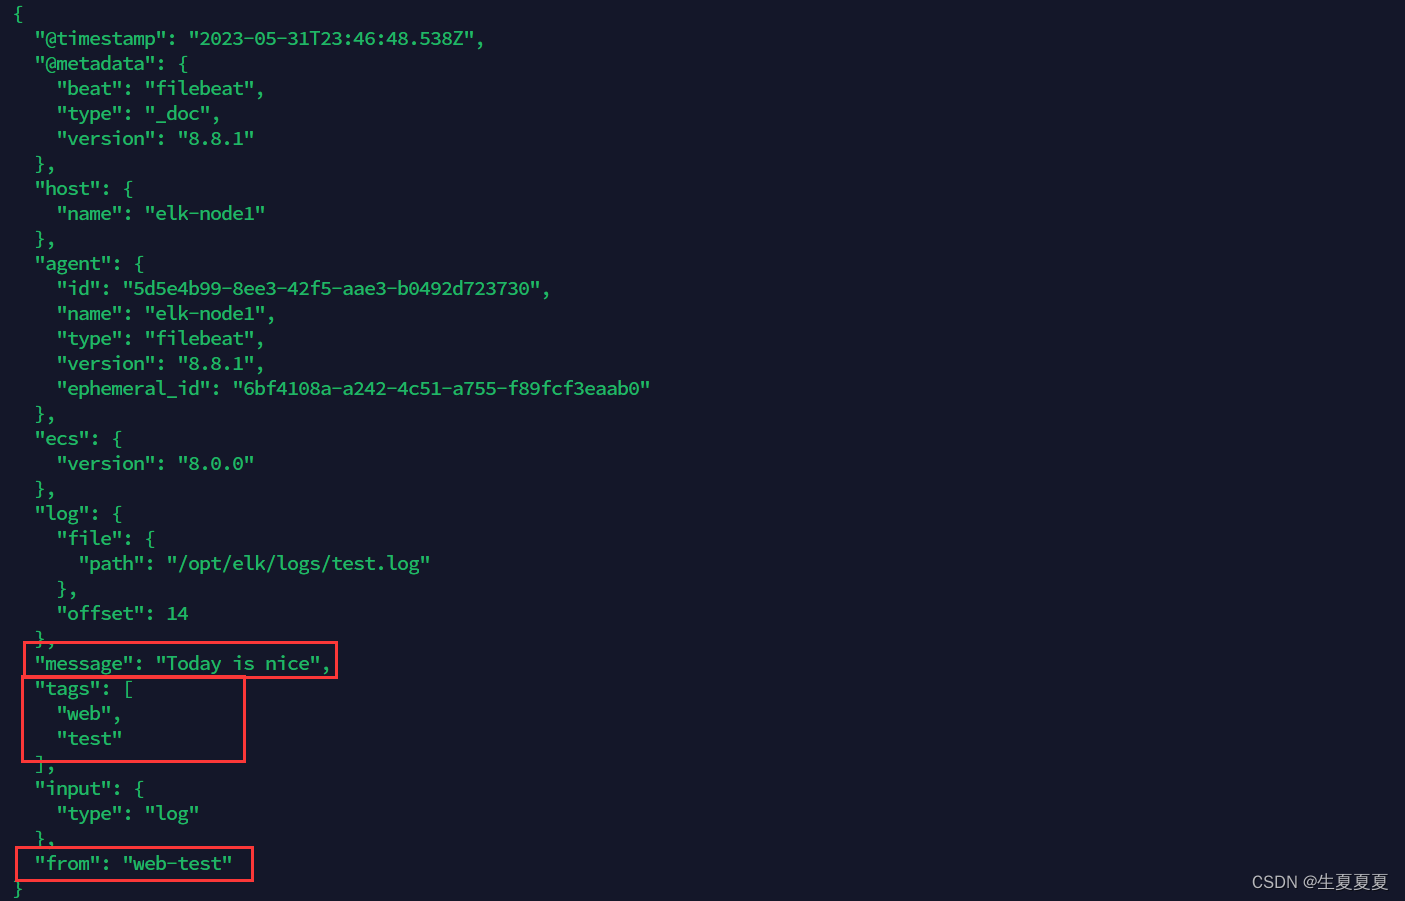
自定义字段
当我们的元数据没办法支撑我们的业务时,我们还可以自定义添加一些字段
filebeat.inputs:
- type: log
  enabled: true
  paths:
    - /opt/elk/logs/*.log
  tags: ["web", "test"]  #添加自定义tag,便于后续的处理
  fields:  #添加自定义字段
    from: web-test
  fields_under_root: true #true为添加到根节点,false为添加到子节点中
setup.template.settings:
  index.number_of_shards: 3
output.console:
  pretty: true
  enable: true
添加完成后,重启 filebeat
./filebeat -e -c shengxia-log.yml
然后添加新的数据到 test.log中
echo "Today is nice" >> test.log
我们就可以看到字段在原来的基础上,增加了两个
输出到ElasticSearch
我们可以通过配置,将修改成如下所示
filebeat.inputs:
- type: log
enabled: true
paths:
- /opt/elk/logs/*.log
tags: ["web", "test"]
fields:
from: web-test
fields_under_root: false
setup.template.settings:
index.number_of_shards: 1
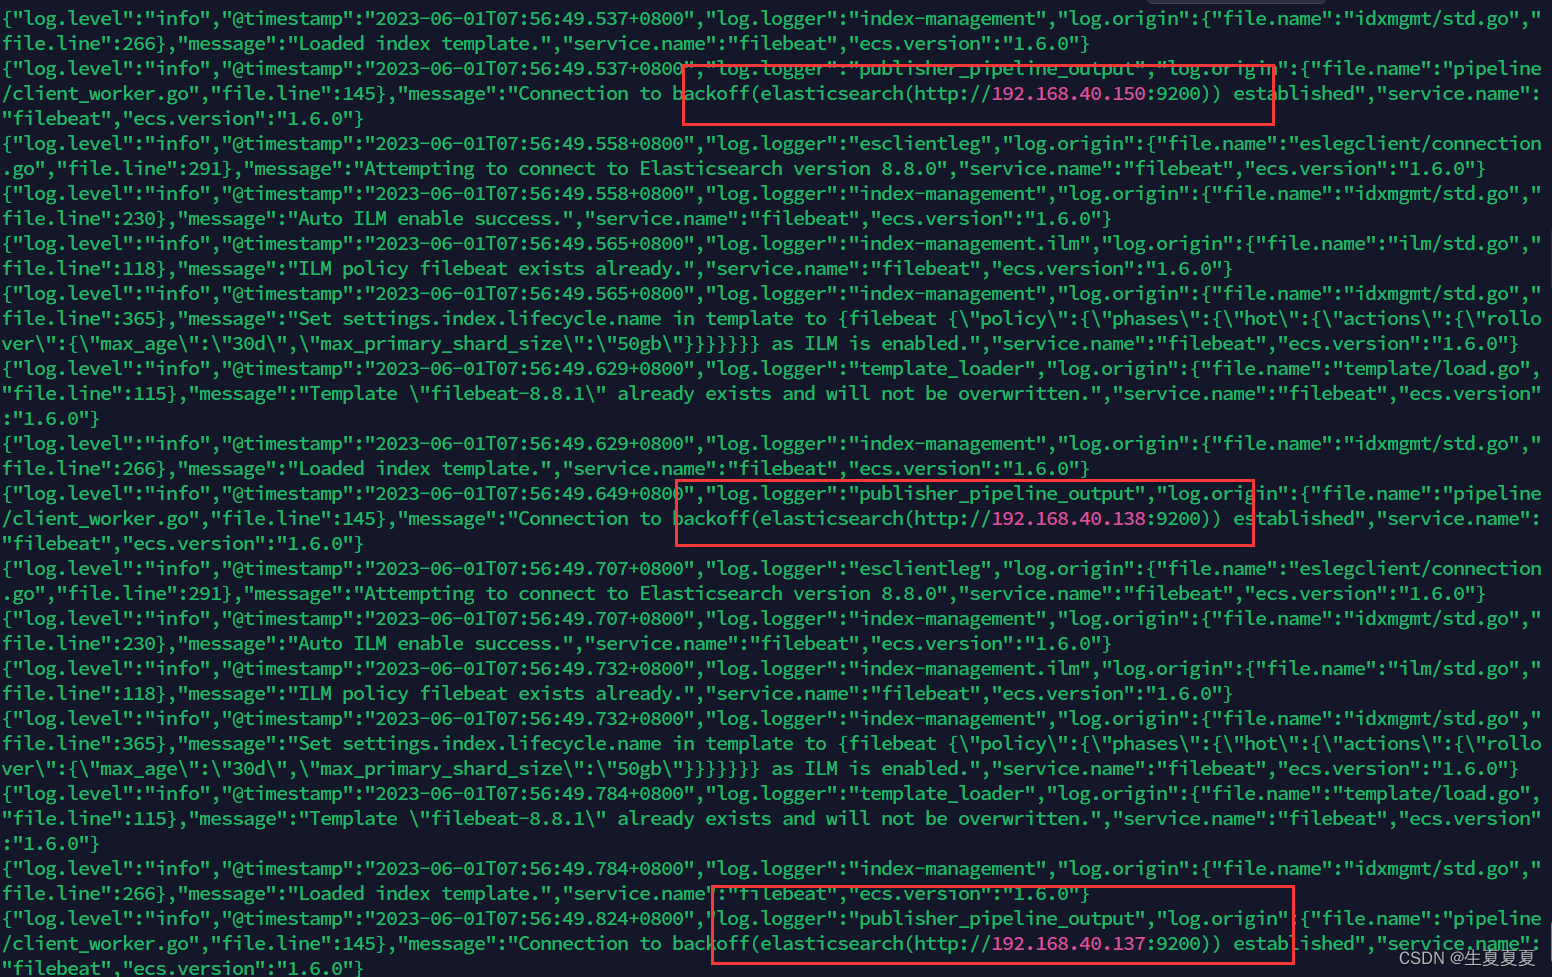
output.elasticsearch:
hosts: ["192.168.40.150:9200","192.168.40.137:9200","192.168.40.138:9200"]
启动成功后,我们就能看到它已经成功连接到了es了
然后我们到刚刚的 logs文件夹向 a.log文件中添加内容
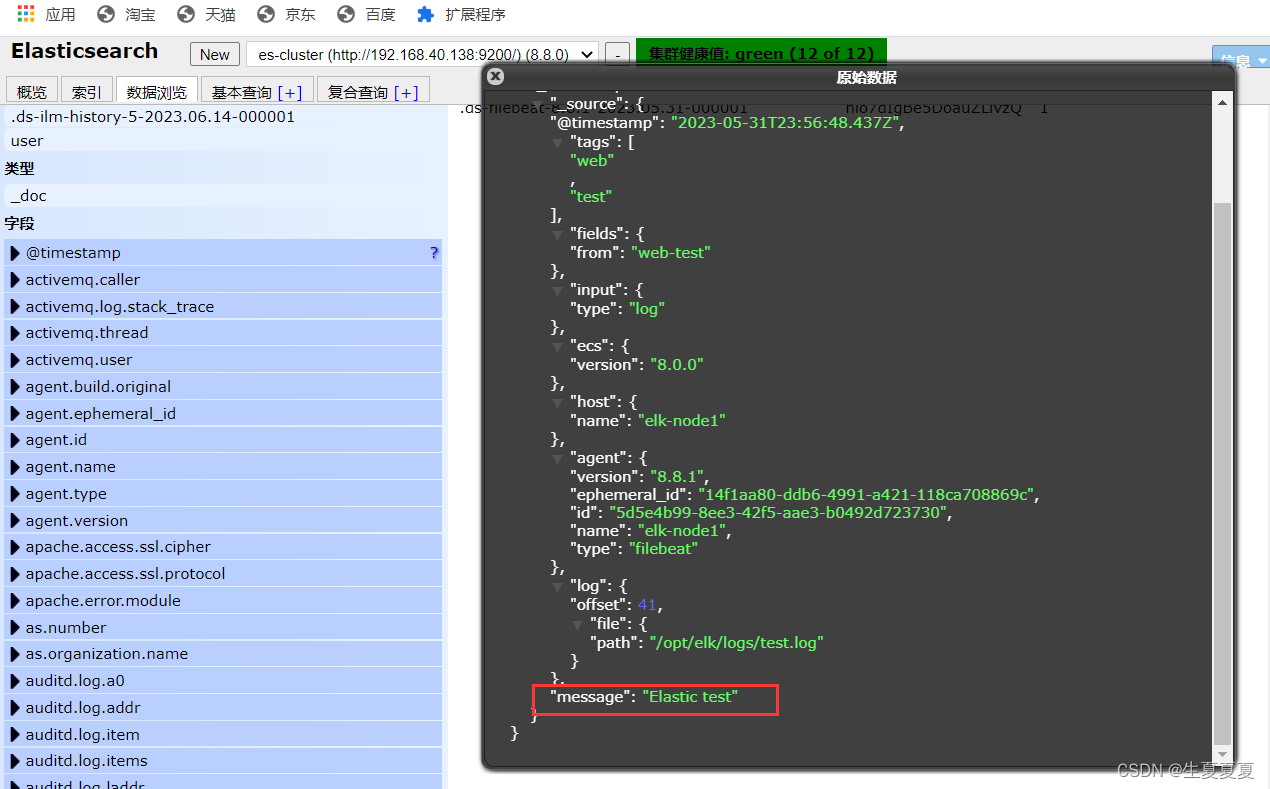
echo "Elastic test" >> test.log
在ES中,我们可以看到,多出了一个 filebeat的索引库
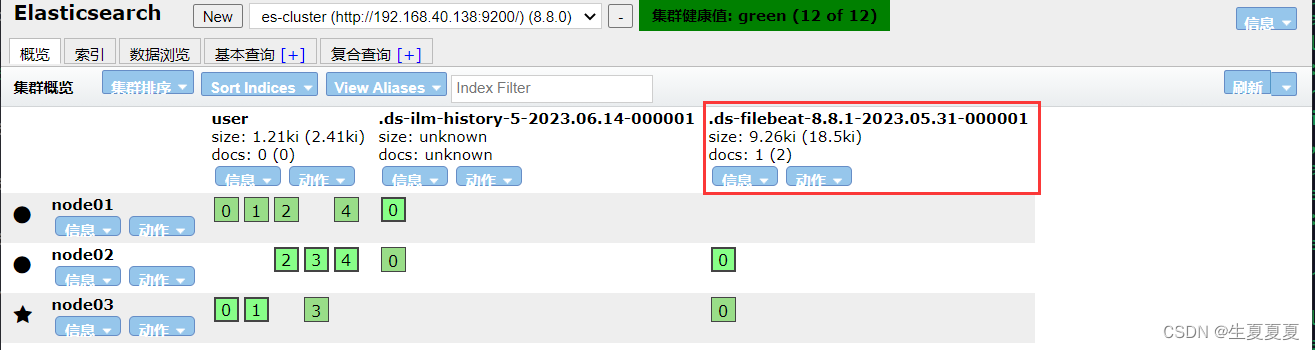
然后我们浏览对应的数据,看看是否有插入的数据内容
Filebeat工作原理
Filebeat主要由下面几个组件组成: harvester、prospector 、input
harvester
- 负责读取单个文件的内容
- harvester逐行读取每个文件(一行一行读取),并把这些内容发送到输出
- 每个文件启动一个harvester,并且harvester负责打开和关闭这些文件,这就意味着harvester运行时文件描述符保持着打开的状态。
- 在harvester正在读取文件内容的时候,文件被删除或者重命名了,那么Filebeat就会续读这个文件,这就会造成一个问题,就是只要负责这个文件的harvester没有关闭,那么磁盘空间就不会被释放,默认情况下,Filebeat保存文件打开直到close_inactive到达
prospector
-
prospector负责管理harvester并找到所有要读取的文件来源
-
如果输入类型为日志,则查找器将查找路径匹配的所有文件,并为每个文件启动一个harvester
-
Filebeat目前支持两种prospector类型:log和stdin
-
Filebeat如何保持文件的状态
- Filebeat保存每个文件的状态并经常将状态刷新到磁盘上的注册文件中
- 该状态用于记住harvester正在读取的最后偏移量,并确保发送所有日志行。
- 如果输出(例如ElasticSearch或Logstash)无法访问,Filebeat会跟踪最后发送的行,并在输出再次可以用时继续读取文件。
- 在Filebeat运行时,每个prospector内存中也会保存的文件状态信息,当重新启动Filebat时,将使用注册文件的数量来重建文件状态,Filebeat将每个harvester在从保存的最后偏移量继续读取
- 文件状态记录在data/registry文件中
input
-
一个input负责管理harvester,并找到所有要读取的源
-
如果input类型是log,则input查找驱动器上与已定义的log路径匹配的所有文件,并为每个文件启动一个harvester
-
每个input都在自己的Go例程中运行
-
下面的例子配置Filebeat从所有匹配指定的log模式的文件中读取行
filebeat.inputs:
- type: log
  paths:
    - /var/log/*.log
    - /var/path2/*.log
启动命令
./filebeat -e -c shengxia-es.yml
./filebeat -e -c shengxia-es.yml -d "publish"
参数说明
- -e:输出到标准输出,默认输出到syslog和logs下
- -c:指定配置文件
- -d:输出debug信息
部署Nginx
部署教程可以参考这篇博客:Nginx的安装启动和停止_
启动完成后,我们通过下面命令,就可以获取到nginx中的内容了
[root@elk-node1 sbin]# tail -f /usr/local/nginx1/logs/access.log
192.168.40.1 - - [01/Jun/2023:05:13:23 +0800] "GET / HTTP/1.1" 200 615 "-" "Mozilla/5.0 (Windows NT 10.0; Win64; x64) AppleWebKit/537.36 (KHTML, like Gecko) Chrome/114.0.0.0 Safari/537.36 Edg/114.0.1823.43"
192.168.40.1 - - [01/Jun/2023:05:13:23 +0800] "GET /favicon.ico HTTP/1.1" 404 555 "http://192.168.40.150:8080/" "Mozilla/5.0 (Windows NT 10.0; Win64; x64) AppleWebKit/537.36 (KHTML, like Gecko) Chrome/114.0.0.0 Safari/537.36 Edg/114.0.1823.43"
读取Nginx中的配置文件
创建一个 nginx-log.yml配置文件,启动nginx的模块功能
./filebeat modules enable nginx
nginx-log.yml配置文件内容
filebeat.inputs:
- type: log
  enabled: true
  paths:
    - /usr/local/nginx1/logs/*.log #nginx日志存放路径
  tags: ["nginx"]
  fields_under_root: false
setup.template.settings:
  index.number_of_shards: 1
output.elasticsearch:
  hosts: ["192.168.40.150:9200","192.168.40.137:9200","192.168.40.138:9200"]
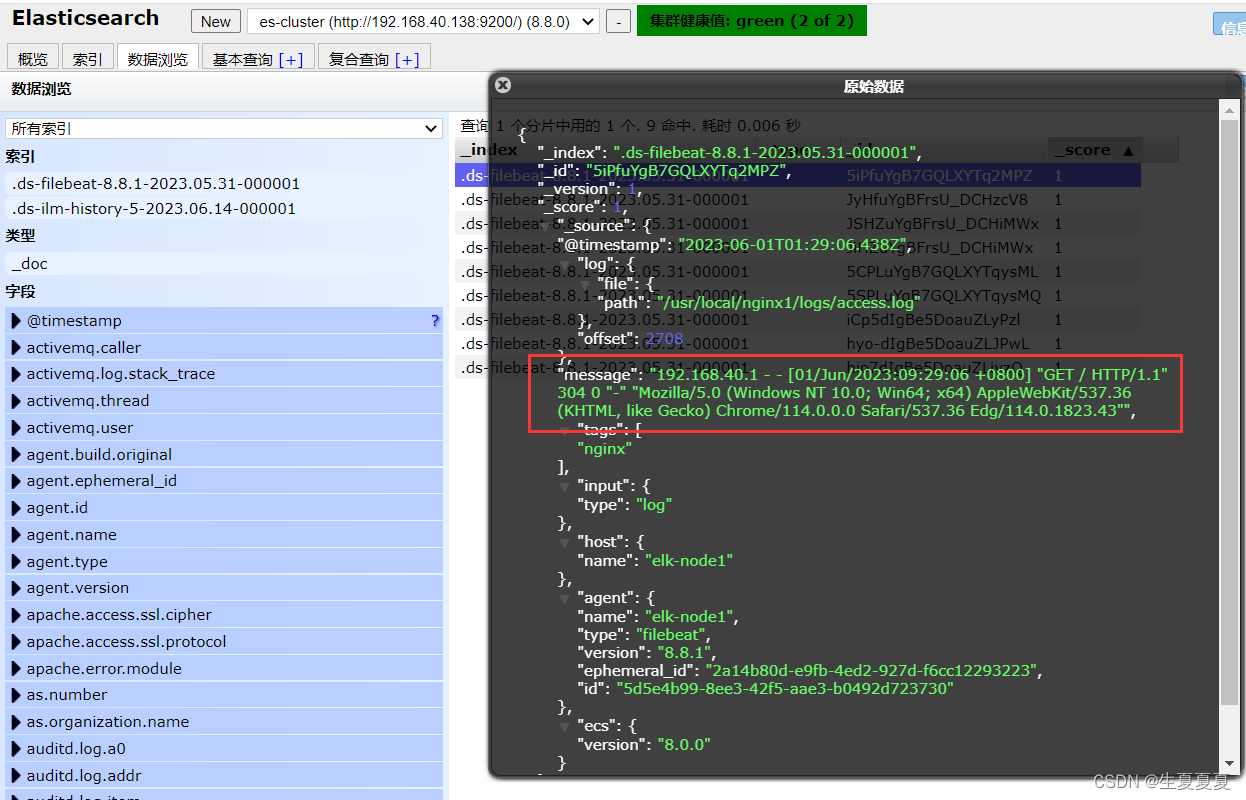
可以看到,在message中已经获取到了nginx的日志,但是,内容并没有经过处理,只是读取到原数据。
Module
要想实现日志数据的读取以及处理都是自己手动配置的,其实,在Filebeat中,有大量的Module,可以简化我们的配置,直接就可以使用,如下:
查看模块列表
./filebeat modules list
你可以看到,内置了很多的module,但是都没有启用,如果需要启用需要进行enable操作:
#启动
./filebeat modules enable nginx
#禁用
./filebeat modules disable nginx
nginx module 配置
我们到下面的目录,就能看到module的配置了
# 进入到module目录
cd modules.d/
#查看文件
vim nginx.yml
得到的文件内容如下所示
# Module: nginx
# Docs: https://www.elastic.co/guide/en/beats/filebeat/7.9/filebeat-module-nginx.html

- module: nginx
  # Access logs
  access:
    enabled: true
    # 添加日志文件
    var.paths: ["/usr/local/nginx1/logs/access.log*"]

    # Set custom paths for the log files. If left empty,
    # Filebeat will choose the paths depending on your OS.
    #var.paths:

  # Error logs
  error:
    enabled: true
    var.paths: ["/usr/local/nginx1/logs/error.log*"]
配置filebeat
我们需要修改刚刚的nginx-log.yml文件,然后添加到我们的module
filebeat.inputs:
setup.template.settings:
  index.number_of_shards: 1
output.elasticsearch:
  hosts: ["192.168.40.150:9200","192.168.40.137:9200","192.168.40.138:9200"]
filebeat.config.modules:
  path: ${path.config}/modules.d/*.yml
  reload.enabled: false
测试
我们启动我们的filebeat
./filebeat -e -c nginx-log.yml
如果启动的时候发现出错
错误1
#只要执行下面两条命令就可以,新版本的ES不会报错
ERROR fileset/factory.go:142 Error loading pipeline: Error loading pipeline for
fileset nginx/access: This module requires the following Elasticsearch plugins:
ingest-user-agent, ingest-geoip. You can install them by running the following
commands on all the Elasticsearch nodes:
  sudo bin/elasticsearch-plugin install ingest-user-agent
  sudo bin/elasticsearch-plugin install ingest-geoip
错误2
#将elasticsearch.yaml文件进行修改成以下内容
#node.roles: [master,data,ingest]
500 Internal Server Error: {\"error\":{\"root_cause\":[{\"type\":\"illegal_state_exception\",\"reason\":\"There are no ingest nodes in this cluster, unable to forward request to an ingest node.\"}],\"type\":\"illegal_state_exception\",\"reason\":\"There are no ingest nodes in this cluster, unable to forward request to an ingest node.\"},\"status\":500}","service.name":"filebeat","ecs.version":"1.6.0"}
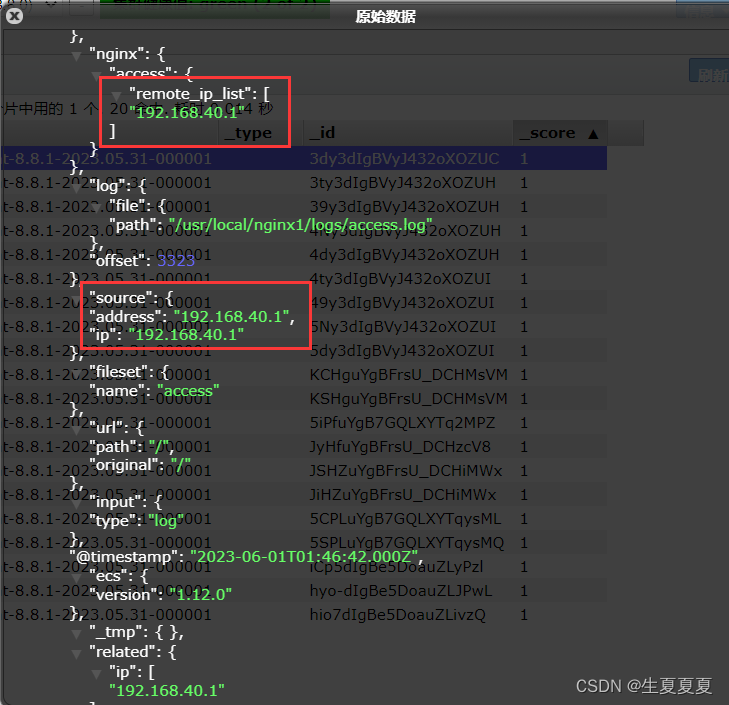
启动成功后,能看到日志记录已经成功刷新进去了
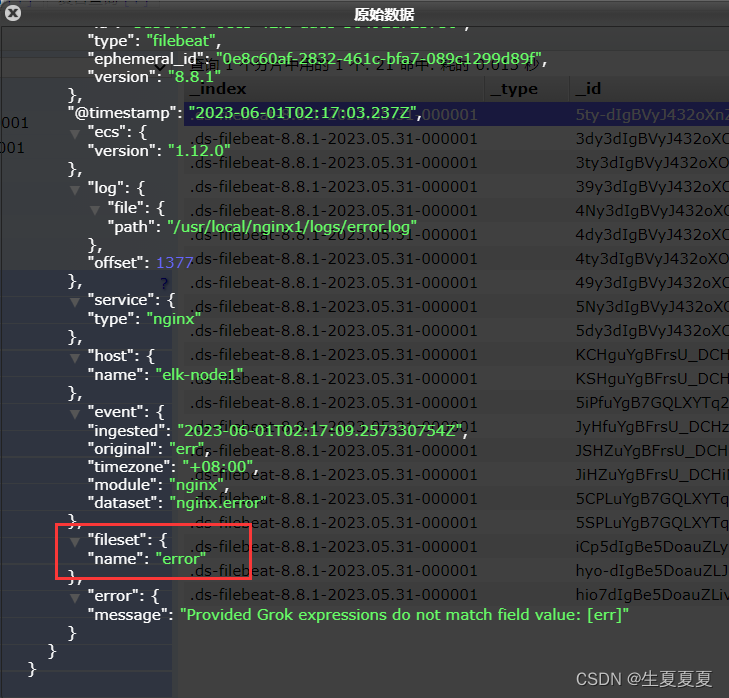
我们可以测试一下,刷新nginx页面,或者向错误日志中,插入数据
echo "err" >> error.log
能够看到,刚刚的记录已经成功插入了
关于module的其它使用,可以参考文档:

旨在为数千万中国开发者提供一个无缝且高效的云端环境,以支持学习、使用和贡献开源项目。
更多推荐


 2
2 0
0- 0


 已为社区贡献4条内容

所有评论(0)