
深度学习目标检测——AP以及MAP
知道了AP的定义,下一步就是理解AP计算的实现,理论上可以通过积分来计算APAP=∫01P(r)drAP=∫01P(r)dr但通常情况下都是使用近似或者插值的方法来计算 AP。
AP计算概述
知道了AP 的定义,下一步就是理解AP计算的实现,理论上可以通过积分来计算AP,公式如下:
A
P
=
∫
0
1
P
(
r
)
d
r
AP=\int_0^1 P(r) dr
AP=∫01P(r)dr
但通常情况下都是使用近似或者插值的方法来计算 AP。
近似计算AP
A P = ∑ k = 1 N P ( k ) Δ r ( k ) AP = \sum_{k=1}^{N}P(k)\Delta r(k) AP=k=1∑NP(k)Δr(k)
- 近似计算 AP(
approximated average precision),这种计算方式是 approximated 形式的; - 很显然位于一条竖直线上的点对计算AP没有贡献;
- 这里
N为数据总量,k为每个样本点的索引, Δ r ( k ) = r ( k ) − r ( k − 1 ) Δr(k)=r(k)−r(k−1) Δr(k)=r(k)−r(k−1)。
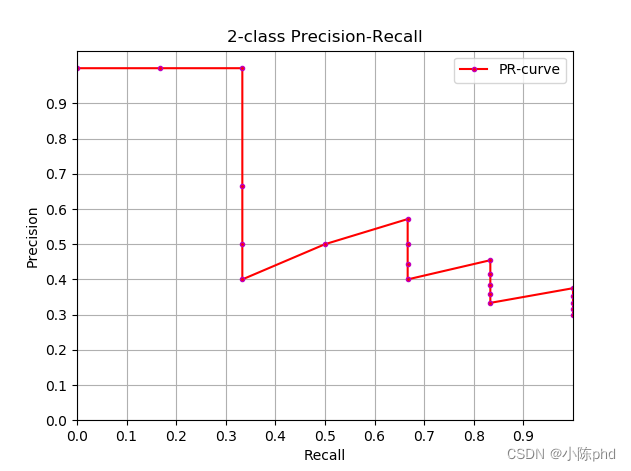
近似计算AP和绘制PR曲线代码如下:
import numpy as np
import matplotlib.pyplot as plt

class_names = ["car", "pedestrians", "bicycle"]

def draw_PR_curve(predict_scores, eval_labels, name, cls_idx=1):
    """calculate AP and draw PR curve, there are 3 types
    Parameters:
    @all_scores: single test dataset predict scores array, (-1, 3)
    @all_labels: single test dataset predict label array, (-1, 3)
    @cls_idx: the serial number of the AP to be calculated, example: 0,1,2,3...
    """
    # print('sklearn Macro-F1-Score:', f1_score(predict_scores, eval_labels, average='macro'))
    global class_names
    fig, ax = plt.subplots(nrows=1, ncols=1, figsize=(15, 10))
    # Rank the predicted scores from large to small, extract their corresponding index(index number), and generate an array
    idx = predict_scores[:, cls_idx].argsort()[::-1]
    eval_labels_descend = eval_labels[idx]
    pos_gt_num = np.sum(eval_labels == cls_idx) # number of all gt

    predict_results = np.ones_like(eval_labels)
    tp_arr = np.logical_and(predict_results == cls_idx, eval_labels_descend == cls_idx) # ndarray
    fp_arr = np.logical_and(predict_results == cls_idx, eval_labels_descend != cls_idx)

    tp_cum = np.cumsum(tp_arr).astype(float) # ndarray, Cumulative sum of array elements.
    fp_cum = np.cumsum(fp_arr).astype(float)

    precision_arr = tp_cum / (tp_cum + fp_cum) # ndarray
    recall_arr = tp_cum / pos_gt_num
    ap = 0.0
    prev_recall = 0
    for p, r in zip(precision_arr, recall_arr):
      ap += p * (r - prev_recall)
      # pdb.set_trace()
      prev_recall = r
    print("------%s, ap: %f-----" % (name, ap))

    fig_label = '[%s, %s] ap=%f' % (name, class_names[cls_idx], ap)
    ax.plot(recall_arr, precision_arr, label=fig_label)

    ax.legend(loc="lower left")
    ax.set_title("PR curve about class: %s" % (class_names[cls_idx]))
    ax.set(xticks=np.arange(0., 1, 0.05), yticks=np.arange(0., 1, 0.05))
    ax.set(xlabel="recall", ylabel="precision", xlim=[0, 1], ylim=[0, 1])

    fig.savefig("./pr-curve-%s.png" % class_names[cls_idx])
    plt.close(fig)
插值计算AP
插值计算(Interpolated average precision) AP 的公式的演变过程这里不做讨论,详情可以参考这篇文章,我这里的公式和图也是参考此文章的。11点插值计算方式计算AP公式如下:
A
P
=
1
11
∑
r
∈
{
0
,
0.1
,
0.2
,
…
,
1.0
}
P
intep
(
r
)
P
interp
(
r
)
=
M
A
X
r
^
:
r
^
≥
r
P
(
r
^
)
\begin{gathered} A P=\frac{1}{11} \sum_{r \in\{0,0.1,0.2, \ldots, 1.0\}} P_{\text {intep }}(r) \\ P_{\text {interp }}(r)=M A X_{\hat{r}: \hat{r} \geq r} P(\hat{r}) \end{gathered}
AP=111r∈{0,0.1,0.2,…,1.0}∑Pintep (r)Pinterp (r)=MAXr^:r^≥rP(r^)
- 这是通常意义上的 11 points_Interpolated 形式的 AP,选取固定的 {0,0.1,0.2,…,1.0} 11个阈值,这个在PASCAL2007中有使用
- 这里因为参与计算的只有11个点,所以 K=11,称为11points_Interpolated,k为阈值索引
- P i n t e r p ( k ) P_{interp}(k) Pinterp(k) 取第 k 个阈值所对应的样本点之后的样本中的最大值,只不过这里的阈值被限定在了 {0,0.1,0.2,…,1.0} 范围内。
[外链图片转存失败,源站可能有防盗链机制,建议将图片保存下来直接上传(img-KaGONv2a-1662646748371)(…/…/images/插值计算AP的PR曲线图.png)]
从曲线上看,真实 AP< approximated AP < Interpolated AP,11-points Interpolated AP 可能大也可能小,当数据量很多的时候会接近于 Interpolated AP,与 Interpolated AP 不同,前面的公式中计算 AP 时都是对 PR 曲线的面积估计,PASCAL的论文里给出的公式就更加简单粗暴了,直接计算11 个阈值处的 precision 的平均值。PASCAL 论文给出的 11 点计算 AP 的公式如下。
[外链图片转存失败,源站可能有防盗链机制,建议将图片保存下来直接上传(img-AF2dVFBg-1662646748371)(…/…/images/11点计算AP公式.png)]
三,AP计算实现
1, 在给定 recal 和 precision 的条件下计算 AP:
def voc_ap(rec, prec, use_07_metric=False):
    """
    ap = voc_ap(rec, prec, [use_07_metric])
    Compute VOC AP given precision and recall.
    If use_07_metric is true, uses the
    VOC 07 11 point method (default:False).
    """
    if use_07_metric:
        # 11 point metric
        ap = 0.
        for t in np.arange(0., 1.1, 0.1):
            if np.sum(rec >= t) == 0:
                p = 0
            else:
                p = np.max(prec[rec >= t])
            ap = ap + p / 11.
    else:
        # correct AP calculation
        # first append sentinel values at the end
        mrec = np.concatenate(([0.], rec, [1.]))
        mpre = np.concatenate(([0.], prec, [0.]))

        # compute the precision envelope
        for i in range(mpre.size - 1, 0, -1):
            mpre[i - 1] = np.maximum(mpre[i - 1], mpre[i])

        # to calculate area under PR curve, look for points
        # where X axis (recall) changes value
        i = np.where(mrec[1:] != mrec[:-1])[0]

        # and sum (\Delta recall) * prec
        ap = np.sum((mrec[i + 1] - mrec[i]) * mpre[i + 1])
    return ap
2,给定目标检测结果文件和测试集标签文件 xml 等计算 AP:
def parse_rec(filename):
    """ Parse a PASCAL VOC xml file
    Return : list, element is dict.
    """
    tree = ET.parse(filename)
    objects = []
    for obj in tree.findall('object'):
        obj_struct = {}
        obj_struct['name'] = obj.find('name').text
        obj_struct['pose'] = obj.find('pose').text
        obj_struct['truncated'] = int(obj.find('truncated').text)
        obj_struct['difficult'] = int(obj.find('difficult').text)
        bbox = obj.find('bndbox')
        obj_struct['bbox'] = [int(bbox.find('xmin').text),
                              int(bbox.find('ymin').text),
                              int(bbox.find('xmax').text),
                              int(bbox.find('ymax').text)]
        objects.append(obj_struct)

    return objects

def voc_eval(detpath,
             annopath,
             imagesetfile,
             classname,
             cachedir,
             ovthresh=0.5,
             use_07_metric=False):
    """rec, prec, ap = voc_eval(detpath,
                                annopath,
                                imagesetfile,
                                classname,
                                [ovthresh],
                                [use_07_metric])
    Top level function that does the PASCAL VOC evaluation.
    detpath: Path to detections result file
        detpath.format(classname) should produce the detection results file.
    annopath: Path to annotations file
        annopath.format(imagename) should be the xml annotations file.
    imagesetfile: Text file containing the list of images, one image per line.
    classname: Category name (duh)
    cachedir: Directory for caching the annotations
    [ovthresh]: Overlap threshold (default = 0.5)
    [use_07_metric]: Whether to use VOC07's 11 point AP computation
        (default False)
    """
    # assumes detections are in detpath.format(classname)
    # assumes annotations are in annopath.format(imagename)
    # assumes imagesetfile is a text file with each line an image name
    # cachedir caches the annotations in a pickle file

    # first load gt
    if not os.path.isdir(cachedir):
        os.mkdir(cachedir)
    cachefile = os.path.join(cachedir, '%s_annots.pkl' % imagesetfile)
    # read list of images
    with open(imagesetfile, 'r') as f:
        lines = f.readlines()
    imagenames = [x.strip() for x in lines]

    if not os.path.isfile(cachefile):
        # load annotations
        recs = {}
        for i, imagename in enumerate(imagenames):
            recs[imagename] = parse_rec(annopath.format(imagename))
            if i % 100 == 0:
                print('Reading annotation for {:d}/{:d}'.format(
                    i + 1, len(imagenames)))
        # save
        print('Saving cached annotations to {:s}'.format(cachefile))
        with open(cachefile, 'wb') as f:
            pickle.dump(recs, f)
    else:
        # load
        with open(cachefile, 'rb') as f:
            try:
                recs = pickle.load(f)
            except:
                recs = pickle.load(f, encoding='bytes')

    # extract gt objects for this class
    class_recs = {}
    npos = 0
    for imagename in imagenames:
        R = [obj for obj in recs[imagename] if obj['name'] == classname]
        bbox = np.array([x['bbox'] for x in R])
        difficult = np.array([x['difficult'] for x in R]).astype(np.bool)
        det = [False] * len(R)
        npos = npos + sum(~difficult)
        class_recs[imagename] = {'bbox': bbox,
                                 'difficult': difficult,
                                 'det': det}

    # read dets
    detfile = detpath.format(classname)
    with open(detfile, 'r') as f:
        lines = f.readlines()

    splitlines = [x.strip().split(' ') for x in lines]
    image_ids = [x[0] for x in splitlines]
    confidence = np.array([float(x[1]) for x in splitlines])
    BB = np.array([[float(z) for z in x[2:]] for x in splitlines])

    nd = len(image_ids)
    tp = np.zeros(nd)
    fp = np.zeros(nd)

    if BB.shape[0] > 0:
        # sort by confidence
        sorted_ind = np.argsort(-confidence)
        sorted_scores = np.sort(-confidence)
        BB = BB[sorted_ind, :]
        image_ids = [image_ids[x] for x in sorted_ind]

        # go down dets and mark TPs and FPs
        for d in range(nd):
            R = class_recs[image_ids[d]]
            bb = BB[d, :].astype(float)
            ovmax = -np.inf
            BBGT = R['bbox'].astype(float)

            if BBGT.size > 0:
                # compute overlaps
                # intersection
                ixmin = np.maximum(BBGT[:, 0], bb[0])
                iymin = np.maximum(BBGT[:, 1], bb[1])
                ixmax = np.minimum(BBGT[:, 2], bb[2])
                iymax = np.minimum(BBGT[:, 3], bb[3])
                iw = np.maximum(ixmax - ixmin + 1., 0.)
                ih = np.maximum(iymax - iymin + 1., 0.)
                inters = iw * ih

                # union
                uni = ((bb[2] - bb[0] + 1.) * (bb[3] - bb[1] + 1.) +
                       (BBGT[:, 2] - BBGT[:, 0] + 1.) *
                       (BBGT[:, 3] - BBGT[:, 1] + 1.) - inters)

                overlaps = inters / uni
                ovmax = np.max(overlaps)
                jmax = np.argmax(overlaps)

            if ovmax > ovthresh:
                if not R['difficult'][jmax]:
                    if not R['det'][jmax]:
                        tp[d] = 1.
                        R['det'][jmax] = 1
                    else:
                        fp[d] = 1.
            else:
                fp[d] = 1.

    # compute precision recall
    fp = np.cumsum(fp)
    tp = np.cumsum(tp)
    rec = tp / float(npos)
    # avoid divide by zero in case the first detection matches a difficult
    # ground truth
    prec = tp / np.maximum(tp + fp, np.finfo(np.float64).eps)
    ap = voc_ap(rec, prec, use_07_metric)

    return rec, prec, ap
四,map计算方法
因为 mAP 值的计算是对数据集中所有类别的 AP 值求平均,所以我们要计算 mAP,首先得知道某一类别的 AP 值怎么求。不同数据集的某类别的 AP 计算方法大同小异,主要分为三种:
(1)在 VOC2007,只需要选取当Recall >= 0, 0.1, 0.2, …, 1共11个点时的Precision最大值,然后AP就是这11个Precision的平均值,map就是所有类别AP值的平均。VOC 数据集中计算 AP 的代码(用的是插值计算方法,代码出自py-faster-rcnn仓库)
(2)在 VOC2010 及以后,需要针对每一个不同的 Recall 值(包括0和1),选取其大于等于这些 Recall 值时的 Precision 最大值,然后计算PR曲线下面积作为 AP 值,map 就是所有类别 AP 值的平均。
(3)COCO 数据集,设定多个 IOU 阈值(0.5-0.95,0.05为步长),在每一个IOU阈值下都有某一类别的 AP 值,然后求不同 IOU 阈值下的 AP 平均,就是所求的最终的某类别的AP值。

旨在为数千万中国开发者提供一个无缝且高效的云端环境,以支持学习、使用和贡献开源项目。
更多推荐


 1
1 0
0- 0


 已为社区贡献3条内容

所有评论(0)