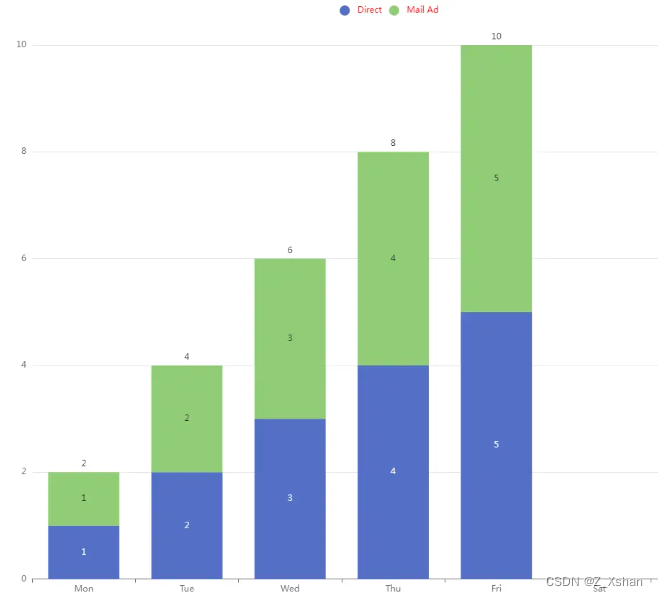
echarts 堆叠柱状图 顶部添加合计
·
先看效果图

一、上代码
//主要是添加这一句
{
      name: '综合',
      type: 'bar',
      stack: 'total',
      label: {
        show: true,
        position: 'top',
        formatter: function (p) { //这里处理展示的数据和
          let sum = arr[p.dataIndex] + arr1[p.dataIndex];
          return sum;
        }
      },
      emphasis: {
        focus: 'series'
      },
      data: [0, 0, 0, 0, 0]//为了隐藏总计bar
    }
let arr=[1,2,3,4,5],arr1=[1,2,3,4,5];
option = {
legend: {//这里自定义legend 隐藏总计
data: [{
name: 'Direct',
// 强制设置图形为圆。
icon: 'circle',
// 设置文本为红色
textStyle: {
color: 'red'
}
},{
name: 'Mail Ad',
// 强制设置图形为圆。
icon: 'circle',
// 设置文本为红色
textStyle: {
color: 'red'
}
}]
},
grid: {
left: '3%',
right: '4%',
bottom: '3%',
containLabel: true
},
yAxis: {
type: 'value'
},
xAxis: {
type: 'category',
data: ['Mon', 'Tue', 'Wed', 'Thu', 'Fri', 'Sat', 'Sun']
},
series: [
{
name: 'Direct',
type: 'bar',
stack: 'total',
label: {
show: true
},
emphasis: {
focus: 'series'
},
data: arr
},
{
name: 'Mail Ad',
type: 'bar',
stack: 'total',
label: {
show: true
},
emphasis: {
focus: 'series'
},
data: arr1
},
{
name: '综合',
type: 'bar',
stack: 'total',
label: {
show: true,
position:'top',
formatter:function(p){
let sum = arr[p.dataIndex] + arr1[p.dataIndex];
return sum
}
},
emphasis: {
focus: 'series'
},
data: [0,0,0,0,0]
}
]
};这里顶部已经可以显示总数了,但是弹出框还存在综合,做个判断隐藏掉即可
tooltip: {
          trigger: "axis",
          axisPointer: {
            type: "shadow",
          },
          formatter: (params) => {
            var res = params[0].name
            for (var i = 0; i < params.length; i++) {
              if (this.adStackArr[params[i].seriesIndex].name != null) {
		    // 这行代码就是判断语句 具体情况 具体分析  自己打印params 来实现自己的判断

                res += `<div >
                  <span style="display:inline-block;margin-right:5px;border-radius:50%;width:10px;height:10px;background-color:${[
                    params[i].color,
                  ]};"></span>
                  ${params[i].seriesName}
                  ${params[i].data}
                </div>`;
              }
            }
            return res; //最后返回的数据得一个字符串 并且支持html css 显示我用的都是行内式样式 拼接成一个字符串 给最后显示 数遍悬浮的样式也是在这里设置 你的字符串是什么样式  渲染出来就是什么样的
          }
        },
更多推荐
 已为社区贡献4条内容


所有评论(0)