【R语言】24种R语言作图新手入门之barplot柱状图(一)
·
目录
一、前言
柱状图又称条形图,在统计分析中的使用频率最高,也是众多小白入门R最早绘制的可视化图形。
二、初阶画图
2.1 基本条形图
values <- c(0.4, 0.75, 0.2, 0.6, 0.5)
barplot(values,
col = "#1b98e0")  #可自行更换颜色

2.2 水平柱状图
barplot(values,
        horiz = TRUE)   #水平柱状图

2.3 带图例的堆叠柱状图
#构建数据
data <- as.matrix(data.frame(A = c(0.2, 0.4),
                             B = c(0.3, 0.1),
                             C = c(0.7, 0.1),
                             D = c(0.1, 0.2),
                             E = c(0.3, 0.3)))
rownames(data) <- c("Group 1", "Group 2")
#绘图
barplot(data,
        col = c("#1b98e0", "#353436"))
#图例
legend("topright",
       legend = c("Group 1", "Group 2"),
       fill = c("#1b98e0", "#353436"))

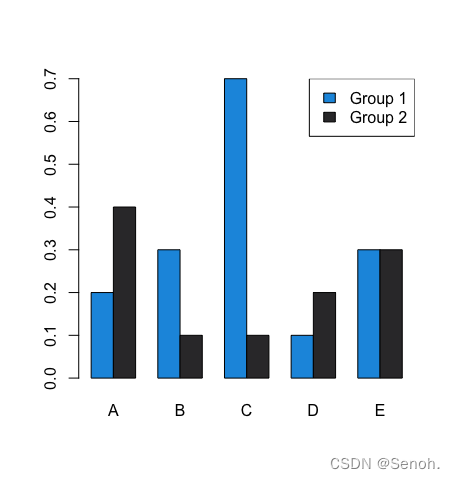
2.4 带图例的分组柱状图
#绘图
barplot(data,
        col = c("#1b98e0", "#353436"),
        beside = TRUE)
#图例
legend("topright",
       legend = c("Group 1", "Group 2"),
       fill = c("#1b98e0", "#353436"))

2.5 用ggplot2作图
#下载和加载包
install.packages("ggplot2")
library("ggplot2")
#构建数据框
group <- LETTERS[1:5]
data_ggp <- data.frame(group, values)
#绘图
ggplot(data_ggp, aes(x = group, y = values)) +
  geom_bar(stat = "identity")

2.6 用plotly作图
#下载和加载包
install.packages("plotly")
library("plotly")
#绘图
plot_ly(x = group,
        y = values,
        type = "bar")

三、进阶画图
3.1 水平柱状图
和刚刚的初阶一样,只是多添加了标签和y轴,常用于计算靶点交叉数目可视化、多项频数可视化等
#读取文件
rt=read.table(inputFile, header=T, sep="\t",check.names =FALSE)
rt1=table(c(as.vector(rt[,1]),as.vector(rt[,2])))    #统计
rt1=sort(rt1,decreasing =T) #排序

#计算节点交叉个数
out=as.data.frame(rt1)
colnames(out)=c("Gene","Count")
write.table(out,file="counts.txt",sep="\t",quote=F,row.names=F)

#展示前25个
showNum=25
if(nrow(rt1)<showNum){
  showNum=nrow(out)
}
n=as.matrix(rt1)[1:showNum,]

#绘制柱状图
pdf(file=outFile,width=7,height=6)
par(mar=c(5,7,2,3),xpd=T)
bar=barplot(n,
            horiz=TRUE,
            col=col,
            names=FALSE,
            xlim=c(0,ceiling(max(n)/5)*5),
            xlab="Number of adjacent nodes")
text(x=n*0.95,y=bar,n) #显示交叉个数
text(x=-0.2,y=bar,label=names(n),xpd=T,pos=2) #基因名称
dev.off()

3.2 显著性柱状图
常用于展示KEGG通路富集、有统计P值可视化等
library(ggplot2)
rt = read.table(inputFile, header=T, sep="\t", check.names=F)

#按FDR排序
labels=rt[order(rt$FDR,decreasing =T),"Term"]
rt$Term = factor(rt$Term,levels=labels)

#绘制
p=ggplot(data=rt)+
  geom_bar(aes(x=Term, y=Count, fill=FDR), stat='identity')+
  coord_flip() + scale_fill_gradient(low=lowcol, high = highcol)+
  xlab("Term") + ylab("Gene count") +
  theme(axis.text.x=element_text(color="black", size=10),
        axis.text.y=element_text(color="black", size=10)) +
        scale_y_continuous(expand=c(0, 0)) +
        scale_x_discrete(expand=c(0,0))+
        theme_bw()
ggsave(outFile,width=7,height=5)      #保存图片

3.3 堆积百分比柱状图
和刚刚的初阶类似,这里把y轴换成了百分数,常用于免疫浸润、其他需要百分比可视化等
#读取文件
rt=read.table(inputFile,sep="\t",header=T,row.names=1,check.names=F)
rt=t(rt)
col=rainbow(nrow(rt),s=0.7,v=0.7)

#绘制
pdf(outFile,height=10,width=20)
par(las=1,mar=c(8,5,4,16),mgp=c(3,0.1,0),cex.axis=1.5)
a1=barplot(rt,
           col=col,
           border = NA,
           yaxt="n",
           ylab="Relative Percent",
           xaxt="n",
           cex.lab=1.8)

#y轴
a2=axis(2,tick=F,labels=F)
axis(2,a2,paste0(a2*100,"%"))
axis(1,a1,labels=F)
par(srt=60,xpd=T);par(srt=0)
ytick2 = cumsum(rt[,ncol(rt)])
ytick1 = c(0,ytick2[-length(ytick2)])

#图例
legend(par('usr')[2]*0.98,
       par('usr')[4],
       legend=rownames(rt),
       col=col,pch=15,bty="n",cex=1.3)
dev.off()

3.4 分组柱状图
将刚刚初阶的分组柱状图设置为水平即可,常用于GO富集、其他分类频数展示可视化等
#读取文件
rt=read.table(inputFile,header=T,sep="\t",check.names=F)

#绘制
pdf(file=outFile,width=7,height=5)
ggbarplot(rt, x="Term", y="Count", fill = "ONTOLOGY", color = "white",
          orientation = "horiz",   #横向显示
          palette = "nejm",        #配色方案,常用还有npg,aaas,jama,jco
          legend = "right",        #图例位置
          sort.val = "asc",        #倒续,顺序改为desc
          sort.by.groups=TRUE)+    #按组排序
  scale_y_continuous(expand=c(0, 0)) + scale_x_discrete(expand=c(0,0))
dev.off()

四、讨论
还有很多刚入门或者准备入门生信的小伙伴们,特出此系列巩固和提供一些入门帮助。以上代码根据自己的文件内容修改参数都可运行,也可以关注公主号「生信初学者」回复关键词【barplot】获取代码和示例数据。
更多推荐
 已为社区贡献5条内容


所有评论(0)