
解决Vue 中使用Echarts 报There is a chart instance already initialized on the dom.的错误
解决Vue 中使用Echarts 报There is a chart instance already initialized on the dom.的错误问题:在已经写好的echarts上面改动数据,回到页面发现,整个echarts 都没了!控制台报: There is a chart instance already initialized on the dom.大概意思就是dom上已经初始化
一键AI生成摘要,助你高效阅读
问答
·
解决Vue 中使用Echarts 报There is a chart instance already initialized on the dom.的错误
问题:
在已经写好的echarts上面改动数据,回到页面发现,整个echarts 都没了!
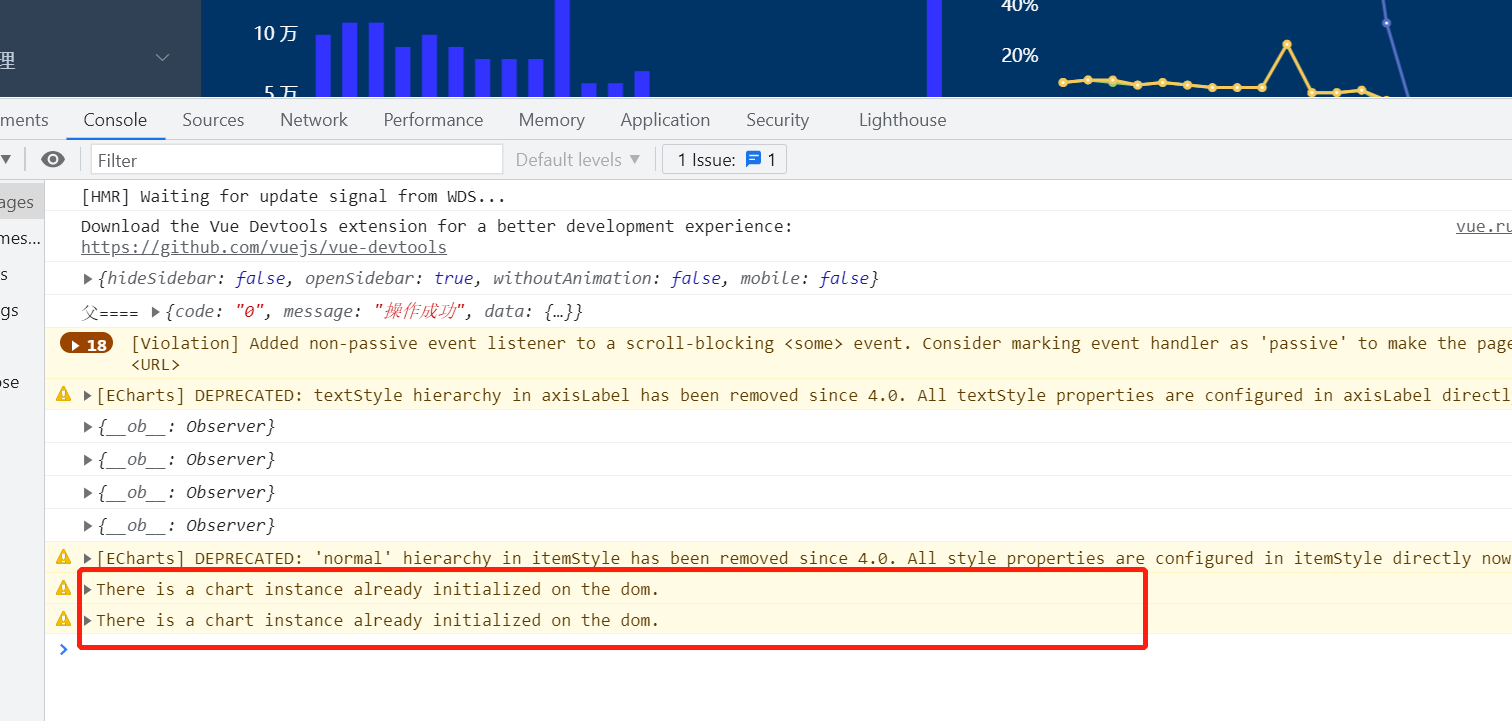
控制台报: There is a chart instance already initialized on the dom.
大概意思就是 dom上已经初始化了一个图表实例。
然后我也上网搜索的一些答案,基本都是一个人解决,是个人传。
	大家看如下网上方法

echarts.dispose(document.getElementById('chart3'))

if (rateChart != null && rateChart != "" && rateChart != undefined) {
        rateChart.dispose();//销毁
 }

几乎都是在init 初始化之前销毁它,这样就可以了,不知道你们成功了没有,反正我是没有成功。
那么真正解决的办法就是,在mounted 生命周期里面再次调用你那获取数据的方法就行了。
大家可以参考下 我的代码片段。
<template>
    <div class="index-pay4" id="index14">
    </div>
</template>

<script>
export default {
  name: 'PortSucc',
  data() {
    return {
      totNumList: [],
      rateList: [],
      succesList: [],

      listAll:{}
    }
  },
  props:['portSucc1'],
  created() {
  },
  watch:{
    portSucc1:{
      handler(a,b) {
        if (JSON.stringify(a) !== '{}') {
          this.listAll = Object.assign({}, a)
          this.lists()
        }
      },
      immediate: true,
      deep: true
    }
  },

  mounted() {
     this.lists() // [再次调用 就可以了,就这简单的一句话!!!]
  },
  methods: {
    lists() {
          this.rateList = this.listAll.rateList
          this.succesList = this.listAll.succesList
          this.totNumList = this.listAll.totNumList
          this.echartsList()
    },
    echartsList() {
        const myEcharts = this.$echarts.init(document.getElementById('index14'))
        const options = {
            title: {
              text: '接口调用成功率',
              textStyle: {
                color: '#fff'
              },
              subtextStyle: {
                color: 'blue'
              },
              padding: [15, 0, 0, 10]
            },
            legend: {
              data: ['百分比', '总和', '数量'],
              show: false
            },
            xAxis: {
              type: 'category',
              data: ['1', '2', '3', '4', '5', '6', '7', '8', '9', '10', '11', '12', '13', '14', '15', '16', '17', '18','19','20', '21', '22','23','24'],
              axisLabel: {
                show: true,
                textStyle: {
                  color: '#fff'
                }
              },
              axisLine: {
                lineStyle: {
                  color: '#fff',
                  width: '.5'
                }
              },
              axisTick: {// x轴刻度线
                show: false
              },
              splitLine: { show: false }, // 隐藏网格
            },
            yAxis: {
              type: 'value',
              axisTick: {// x轴刻度线
                show: false
              },
              axisLabel: {
                formatter: '{value}%'
              },
              splitLine: { show: false }, // 隐藏网格
              axisLine: {
                // show: false,
                lineStyle: {
                  color: '#fff',
                  width: '0.5'
                }
              },
            },
            series: [
              {
                name: '百分比',
                type: 'line',
                data: this.rateList,
                // markPoint: {
                //   data: [
                //     {type: 'max', name: '最大值'},
                //     {type: 'min', name: '最小值'}
                //   ]
                // },
              },
              {
                name: '成功数',
                type: 'line',
                data: this.succesList,
                // markPoint: {
                //   data: [
                //     {type: 'max', name: '最大值'},
                //     {type: 'min', name: '最小值'}
                //   ]
                // },
              },
              {
                name: '总数',
                type: 'line',
                data: this.totNumList,
                // markPoint: {
                //   data: [
                //     {type: 'max', name: '最大值'},
                //     {type: 'min', name: '最小值'}
                //   ]
                // },
              },
              // smooth: true
            ],
            // 鼠标移动上面 显示数据
            tooltip: {
              trigger: 'axis',
              axisPointer: {
                type: 'cross',
                label: {
                  backgroundColor: '#6a7985'
                }
              }
            }
          }
        myEcharts.setOption(options)
    }
  }
}
</script>

<style scoped lang="scss">
  .index-pay4 {
    width: 100%;
    height: 300px;
    /*border: 1px solid #000;*/
    box-sizing: border-box;
  }
</style>

旨在为数千万中国开发者提供一个无缝且高效的云端环境,以支持学习、使用和贡献开源项目。
更多推荐


 6
6 0
0- 0


 已为社区贡献1条内容

所有评论(0)