
echarts实现不展示X轴Y轴轴线、刻度
·
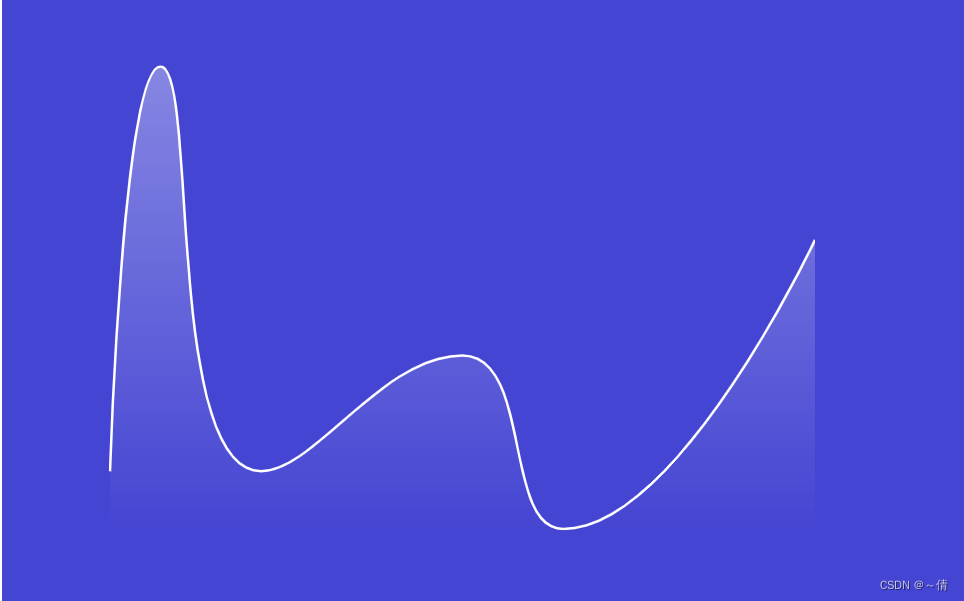
今日工作中需要实现折线图的简图,就是只看个大概趋势不展示具体坐标,查阅了文档记录一下。
<div style="background-color: #4545d3;padding:50px">
    <div id="main" style="width: 600px;height:400px;"></div>
</div>


initCharts(_id, _name, yAxisData, _unit){
	if(this[_id]) this[_id].clear();
	this[_id] = $echarts.init(document.getElementById(_id));
	const options = {
		grid: {//位置
			left: '6%',
			right: 0,
			bottom: 20,
			top: 10,
			containLabel: true//是否包含坐标值
		},
		xAxis: [{
			type: 'time',
			axisLabel: {//坐标轴刻度标签
				show: false
			},
			axisLine: {//坐标轴轴线
				show: false
			},
			axisTick: {//坐标轴刻度
				show: false
			}
		}],
		yAxis: [{
			type: 'value',
			splitLine: {//坐标轴在grid区域中的分割线
				show: false
			},
			axisLabel: {//坐标轴刻度标签
				show: false
			},
		}],
		series: [{
			type: 'line',
			name: _name,
			smooth: true,//是否平滑曲线
			symbol: 'none',//标记的图形,去掉默认的小圆点标识
			data: yAxisData,
			lineStyle: {//线条颜色
				color: '#ffffff'
			},
			areaStyle: {//填充区域渐变色
				color: new $echarts.graphic.LinearGradient(0,0,0,1,[
					{
						offset: 0,
						color: 'rgba(255, 255, 255, 0.5)'
					},{
						offset: 1,
						color: 'rgba(255, 255, 255, 0)'
					}
				])
			}
		}]
	}
	//将实例属性清空,为了解决图表还未渲染时切换页面,再切回来时图表不渲染问题
	document.getElementById(_id).setAttribute('_echarts_instance_', '');
	this[_id].setOption(option);
}


旨在为数千万中国开发者提供一个无缝且高效的云端环境,以支持学习、使用和贡献开源项目。
更多推荐
 2
2 0
0- 0


 已为社区贡献2条内容

所有评论(0)