
10-Echarts 配置系列之:Tooltip 提示组件
简单全面的了解 Echarts 的 Tooltip 提示组件的配置,文章提供 Tooltip 示例的配置代码
一键AI生成摘要,助你高效阅读
问答
·
Tooltip,数据提示工具,用于用户将鼠标悬停在图表上时提供关于数据点的详细信息。 改配置可以在 全局、grid(坐标系)、series(系列)和series.data(系列数据)范围中进行配置。
文章最后的配置代码为 解剖图的示例代码
在之前的 grid 的配置中有完整提示组件配置,下面以全局配置为示例:
一、.提示组件 tooltip 配置
// 全局配置 提示组件
option={
tooltip:{
show:true, // 是否显示提示组件
trigger:'item', // 提示组件触发类型
// 坐标指示器配置 头
axisPointer:{
type:'line', // 指示器类型
axis:'auto', // 指示器的坐标轴
snap:true, // 坐标轴指示器是否吸附到具体的数值点上
z:1, // 坐标轴指示器的 z 值,图形层级
// 指示器文本标签配置 头
label:{
show:true, // 是否显示文本标签
precision:2, // 文本标签中数值的精度,当前保留两位小数点
formatter:'{value}单位', // 文本标签格式器,可以使用方法
margin:10, // 文本标签距离轴的距离
color:'red', // 文字颜色
fontStyle:'normal', // 字体的风格
fontWeight:'normal', // 字体粗细
fontFamily:'serif', // 字体系列
fontSize:15, // 字体大小
lineHeight:15, // 行高
width:100, // 文本显示宽度
height:100, // 文本显示高度
textBorderColor:'red', // 文字描边颜色
textBorderWidth:20, // 文字描边宽度
textBorderType:'solid', // 文字描边类型
textBorderDashOffset:2, // 文字描边为虚线时,虚线的偏移量
textShadowColor:'red', // 文字阴影
textShadowBlur:10, // 文字阴影长度
textShadowOffsetX:10, // 文字阴影水平偏移量
textShadowOffsetY:10, // 文字阴影竖直偏移量
overflow:'truncate', // 文字超出宽度是否截断或者换行
ellipsis:'···', // 文字超出宽度设置为 truncate 时,末尾显示内容
padding:[5,5,5,5], // 文本标签的内边距
backgroundColr:'red', // 文本标签的背景颜色
borderColor:'red', // 文本标签边框颜色
borderWidth:10, // 文本标签的边框宽度
shadowBlur:3, // 文本标签阴影
shadowColor:'red', // 文本标签阴影颜色
shadowOffsetX:10, // 文本标签阴影水平偏移量
shadowOffsetY:10, // 文本标签阴影竖直偏移量
},
// 指示器文本标签配置 尾
// 直线指示器的样式, type 为 line 生效, 头
lineStyle:{
color:'red', // 线的颜色
width:2, // 线的宽度
type:'solid', // 线的类型
dashOffset:10, // 线的类型为虚线时,虚线的偏移量
cap:'butt', // 线段末端形状
join:'bevel', // 两个线段连接部分的形状
miterLimit:10, // join 为 miter 时,斜接面比例
shadowBlur:10, // 线的阴影
shadowColor:'red', // 线的阴影颜色
shadowOffsetX:10, // 阴影水平偏移量
shadowOffsetY:10, // 阴影竖直偏移量
opacity:0.8, // 线的透明度
},
// 直线指示器的样式, type 为 line 生效, 尾
// 阴影指示器图形样式, type 为 shadow 生效, 头
shadowStyle:{
color:'red', // 图形填充颜色
shadowBlur:10, // 图形阴影大小
shadowColor:'red', // 图形阴影颜色
shadowOffsetX:'red', // 图形阴影水平偏移量
shadowOffsetY:'red', // 图形阴影竖直偏移量
opacity:0.8, // 图形透明度
},
// 阴影指示器图形样式, type 为 shadow 生效, 尾
// 十字准星指示器样式,type 为 cross 生效,头
crossStyle:{
color:'red', // 线的颜色
width:2, // 线的宽度
type:'dashed', // 线的类型
dashOffset:10, // 线的类型为虚线时,虚线的偏移量
cap:'butt', // 指定线段末端的图形
join:'bevel', // 两个线段连接处的形状
miterLimit:10, // join 为 miter 时,斜接面比例
shadowBlur:10, // 线的阴影程度
shadowColor:'red', // 线的阴影颜色
shadowOffsetX:10, // 线阴影的水平偏移量
shadowOffsetY:10, // 线阴影的竖直偏移量
opacity:0.8, // 线的透明度
}
// 十字准星指示器样式,type 为 cross 生效 尾
animation:true, // 是否开启动画
animationThreshold:100, // 动画的阈值,当单个系列显示的图形数量大于这个阈值时会关闭动画。
animationDuration:100, // 初始动画时长
animationEasing:'cubicIn', // 初始动画的缓动效果
animationDelay:100, // 初始动画的延迟
animationDurationUpdate:200, // 数据更新动画时长
animationEasingUpdate:'linear', // 数据更新缓动效果
animationDelayUpdate:100, // 数据更新动画延迟
}
// 坐标指示器配置 尾
showContent:true, // 是否显示提示框浮层
alwaysShowContent:true, // 是否一直显示提示框内容
triggerOn:'click', // 提示框触发的条件
showDelay:100, // 浮层显示的延迟时间
hideDelay:100, // 浮层隐藏的延迟
enterable:true, // 鼠标是否可以进入提示框浮层中
renderMode:'html', // 浮层渲染模式
confine:true, // 将 tooltip 框限制在图表区域内
appendToBody:true, // 是否将 tooltip 的 DOM 节点添加到 HTML 的 body 子节点上
className:'name', // 指定 DOM 节点类名
transitionDuration:2, // 提示框浮层的移动动画过度时间,单位 S/秒
position:'left', // 提示框浮层的位置,设置之后就会固定,不会跟随鼠标移动
formatter:'{a}单位' // 提示框浮层内容格式器,模板变量有 {a}, {b},{c},{d},{e},分别表示系列名,数据名,数据值等。
valueFormatter:(value) => '$' + value.toFixed(2), // tooltip 中数值显示部分的格式化回调函数。
backgroundColor:'red', // 提示框浮层的背景颜色
borderColor:'#333', // 提示框浮层的边框颜色
borderWidth:3, // 提示框浮层的边框宽度
padding:[5,5,5,5], // 提示框浮层的内边距
// 提示框浮层的文本样式 头
textStyle:{
color:'red', // 文字的颜色
fontStyle:'normal', // 字体的风格
fontWeight:'normal', // 字体的粗细
fontFamily:'serif', // 字体系列
fontSzie:15, // 字体大小
lineHeight:20, // 行高
width:10, // 文本显示宽度
height:100, // 文本显示高度
textBorderColor:'red', // 文字描边颜色
textBorderWidth:10, // 文字描边宽度
textBorderType:'solid', // 文字描边类型
textBorderDashOffset:10, // 描边类型为虚线时,虚线的偏移量
textShadowColor:'red', // 文字阴影颜色
textShadowBlur:10, // 文字阴影长度
textShadowOffsetX:10, // 文字阴影水平偏移量
textShadowOffsetY:10, // 文字阴影竖直偏移量
overflow:'none', // 文字超出宽度截断或者换行
ellipsis:'···', // overflow 配置为 truncate 的时候,文本末尾显示的文本
}
// 提示框浮层的文本样式 尾
extraCssText:'box-shadow: 0 0 3px rgba(0, 0, 0, 0.3);', // 额外附加到浮层的 css 样式。
order:'seriesAsc', // 多系列提示框浮层排列顺序。
}
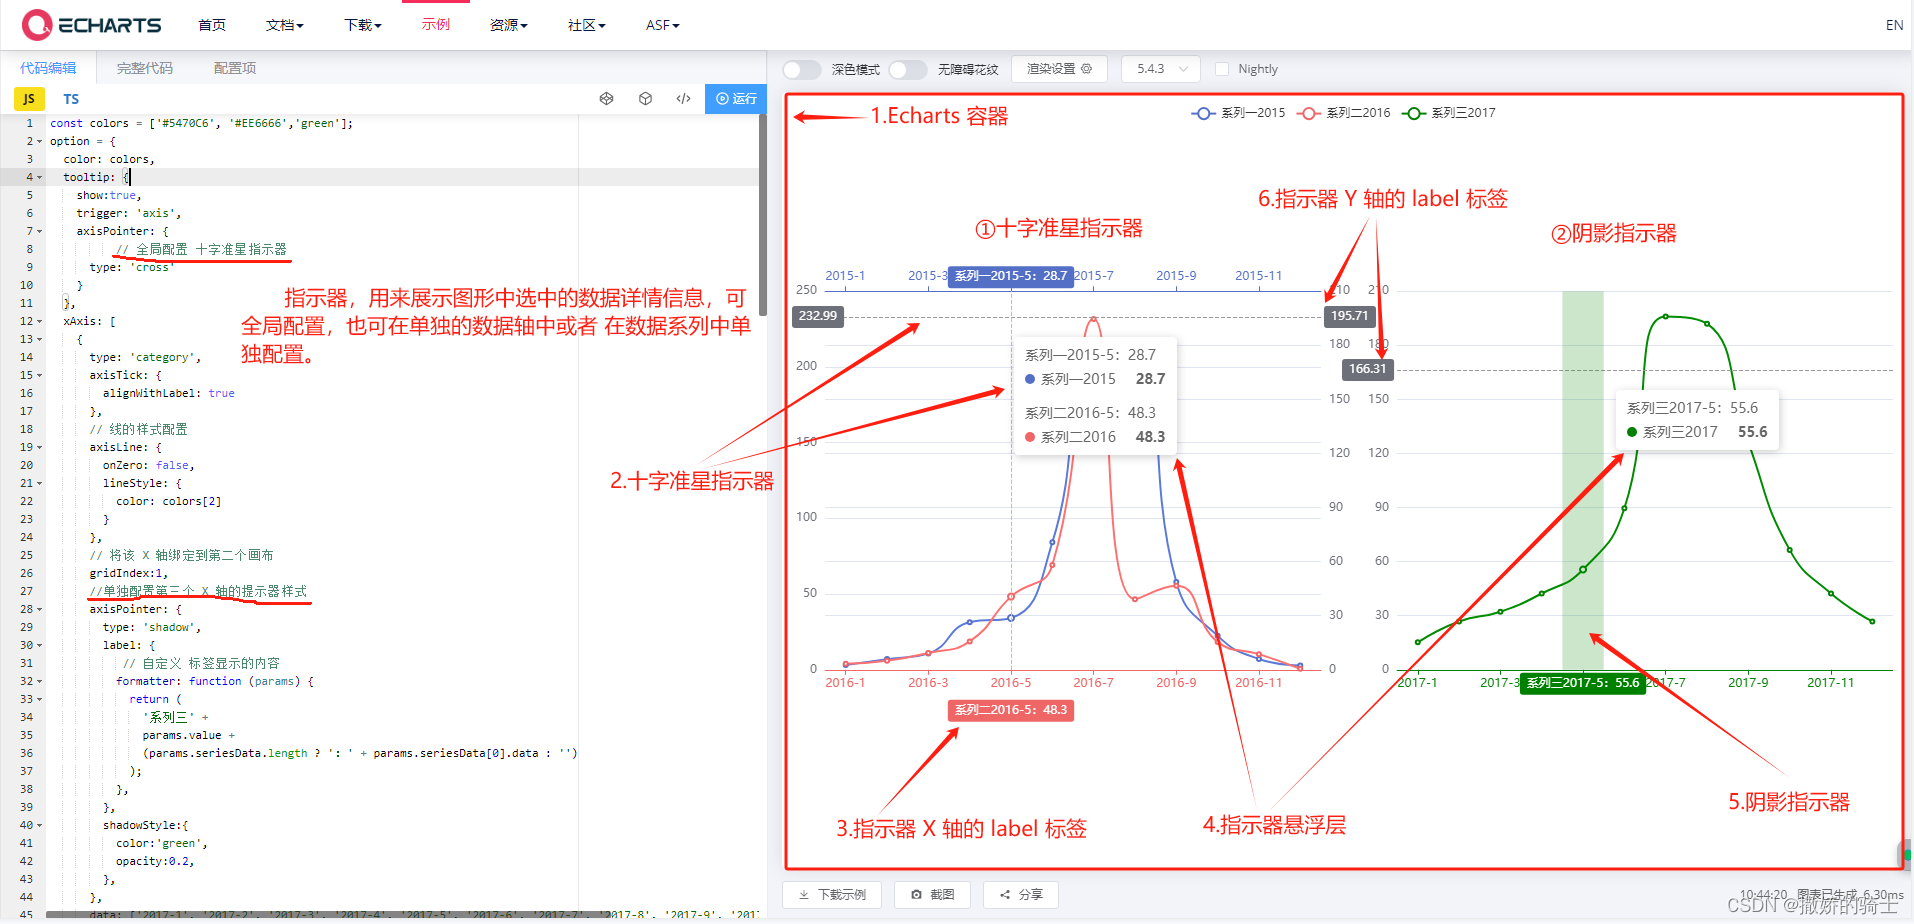
}二、解剖图
三、 解剖图 option 配置代码
使用:
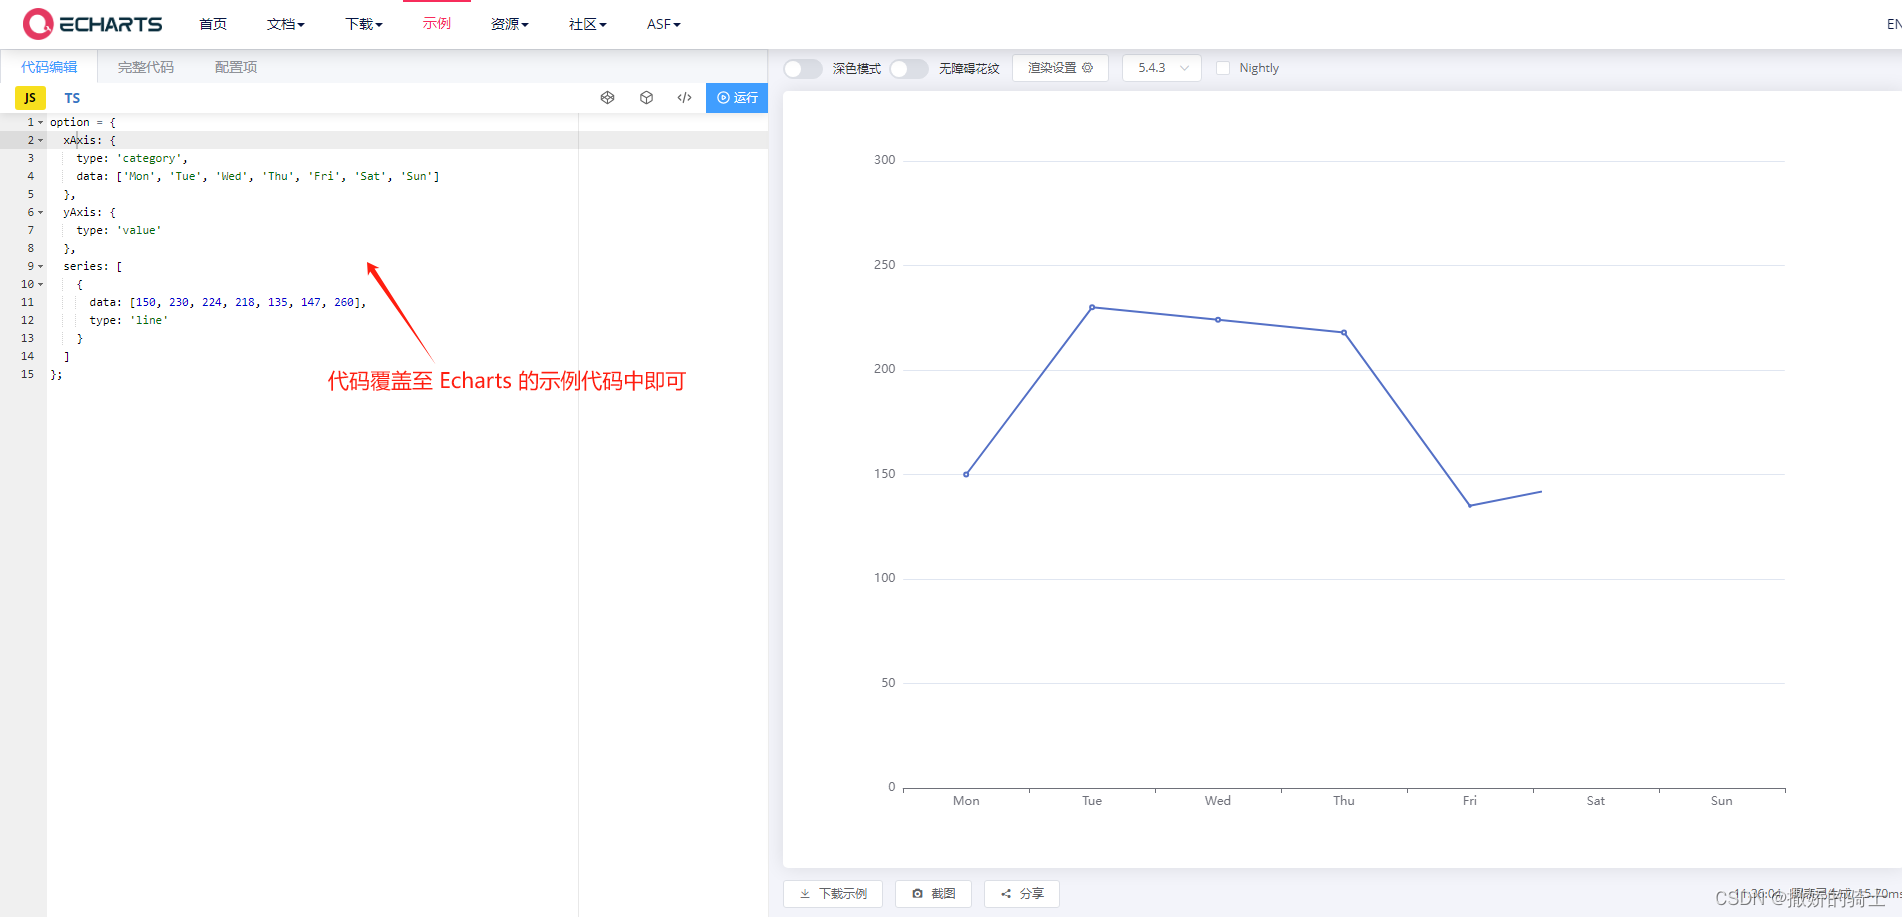
代码:
const colors = ['#5470C6', '#EE6666','green'];
option = {
  color: colors,
  tooltip: {
    show:true,
    trigger: 'axis',
    axisPointer: {
          // 全局配置 十字准星指示器
      type: 'cross'
    }
  },
  xAxis: [
    {
      type: 'category',
      axisTick: {
        alignWithLabel: true
      },
      // 线的样式配置
      axisLine: {
        onZero: false,
        lineStyle: {
          color: colors[2]
        }
      },
      // 将该 X 轴绑定到第二个画布
      gridIndex:1,
      //单独配置第三个 X 轴的提示器样式
      axisPointer: {
        type: 'shadow',
        label: {
           // 自定义 标签显示的内容
          formatter: function (params) {
            return (
              '系列三' +
              params.value +
              (params.seriesData.length ? ':' + params.seriesData[0].data : '')
            );
          },
        },
        shadowStyle:{
          color:'green',
          opacity:0.2,
        },
      },
      data: ['2017-1', '2017-2', '2017-3', '2017-4', '2017-5', '2017-6', '2017-7', '2017-8', '2017-9', '2017-10', '2017-11', '2017-12']
    },
    {
      type: 'category',
      axisTick: {
        alignWithLabel: true
      },
      axisLine: {
        onZero: false,
        lineStyle: {
          color: colors[1]
        }
      },
      // 单独配置第二个 X 轴的提示器样式
      axisPointer: {
           show:true,
        label: {
          formatter: function (params) {
            return (
              '系列二' +
              params.value +
              (params.seriesData.length ? ':' + params.seriesData[0].data : '')
            );
          },
          margin:30,
        },
      },
      data: ['2016-1', '2016-2', '2016-3', '2016-4', '2016-5', '2016-6', '2016-7', '2016-8', '2016-9', '2016-10', '2016-11', '2016-12']
    },
    {
      type: 'category',
      axisTick: {
        alignWithLabel: true
      },
      axisLine: {
        onZero: false,
        lineStyle: {
          color: colors[0]
        }
      },

      // 单独配置第三个 X 轴的提示器样式
      axisPointer: {

        label: {
          formatter: function (params) {
            return (
              '系列一' +
              params.value +
              (params.seriesData.length ? ':' + params.seriesData[0].data : '')
            );
          }
        }
      },
      data: ['2015-1', '2015-2', '2015-3', '2015-4', '2015-5', '2015-6', '2015-7', '2015-8', '2015-9', '2015-10', '2015-11', '2015-12']
    },
  ],
    legend: {},
  grid:[{
    width:'45%',
    height:'50%',
    top: '25%',
    left:'3%'
  },{
    width:'45%',
    height:'50%',
    top: '25%',
    left:'55%'
  }
    ],

 // y 轴未配置
  yAxis: [
     {
      type: 'value',
      gridIndex:1,
    },
     {
      type: 'value',

    },
     {
      type: 'value',

    },
  ],
  series: [
    {
      name: '系列一2015',
      type: 'line',
      // 该系列绑定在 第三个 X 轴上来绘制
      xAxisIndex: 2,
      yAxisIndex:2,
      smooth: true,
      emphasis: {
        focus: 'series'
      },
      data: [
        2.6, 5.9, 9.0, 26.4, 28.7, 70.7, 175.6, 182.2, 48.7, 18.8, 6.0, 2.3
      ]
    },
    {
      name: '系列二2016',
      type: 'line',
      // 该系列绑定在 第二个 X 轴上来绘制
      xAxisIndex: 1,
      yAxisIndex:1,
      smooth: true,
      emphasis: {
        focus: 'series'
      },
      data: [
        3.9, 5.9, 11.1, 18.7, 48.3, 69.2, 231.6, 46.6, 55.4, 18.4, 10.3, 0.7
      ]
    },
    {
      name: '系列三2017',
      type: 'line',
      smooth: true,
       // 该系列绑定在 第一个 X 轴上来绘制
      xAxisIndex:0,
      yAxisIndex:0,
      emphasis: {
        focus: 'series'
      },
      data: [
        15.2,26.8,32.2,42.3,55.6,89.6,196,192,126,66.5,42.3,26.8
      ]
    }
  ]
};
旨在为数千万中国开发者提供一个无缝且高效的云端环境,以支持学习、使用和贡献开源项目。
更多推荐


 1
1 0
0- 0


 已为社区贡献7条内容

所有评论(0)