
vue实现 【echarts中 “4种” Gauge仪表盘进度条图例】的组件封装及调用
1、安装echartsnpm install echarts --save2、在需要的页面引入import * as echarts from "echarts"3、echarts.vue 组件<template><div class="per_page"><div id="perChart"></div><img class="per_img
一键AI生成摘要,助你高效阅读
问答
·
echarts组件使用参考:https://blog.csdn.net/weixin_50450473/article/details/121510438
目录
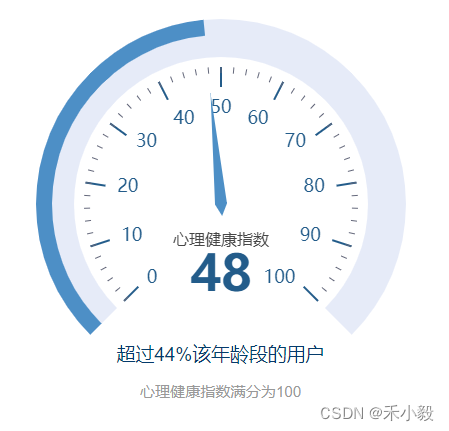
图例一:
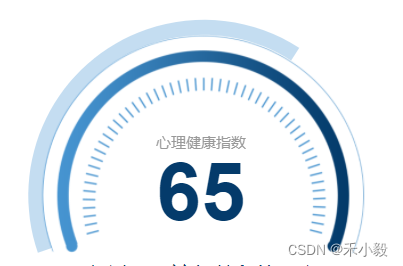
图例二:
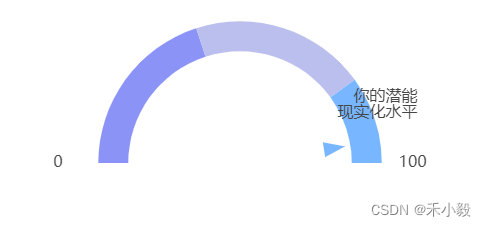
图例三:文字位置根据指针值变化而变化
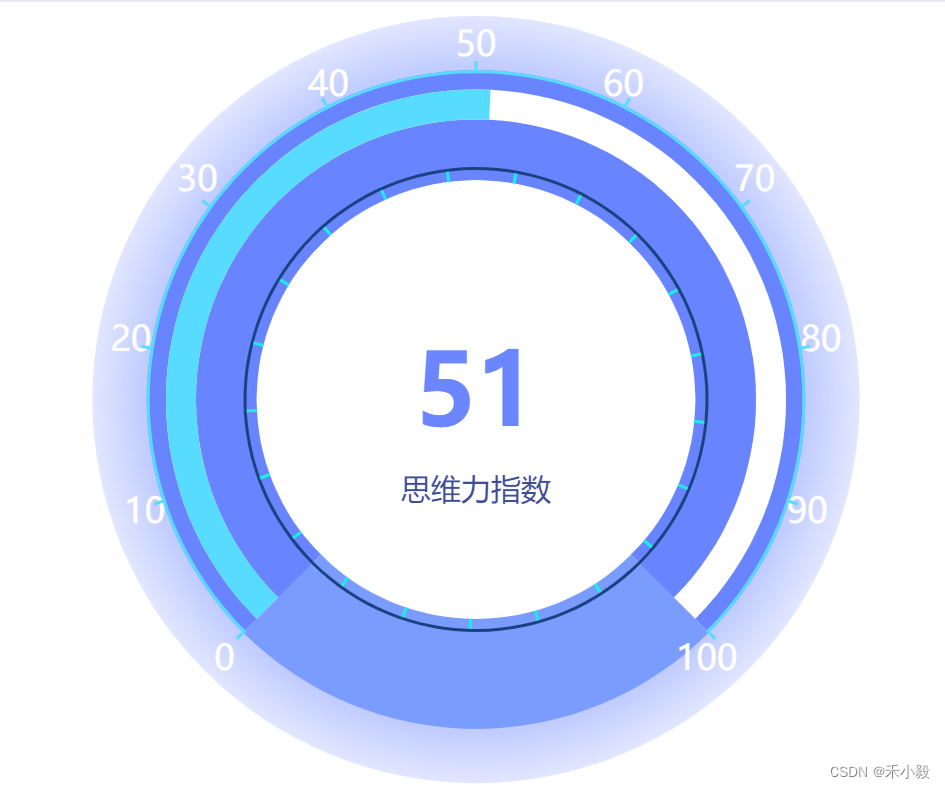
图例四:
图例一
<template>
    <div class="per_page">
        <div id="perChart"></div>
        <img class="per_img" src="@/assets/prosss.png" alt="">
        <div class="per_bg">
            <p>心理健康指数</p>
            <p>{{percentage}}</p>
        </div>
    </div>
</template>
<script>
import * as echarts from 'echarts'
export default {
    props: {
        percentage: {
            type: Number,
            default: 0
        }
    },
    created() {
        this.$nextTick(() => {
            this.perBtn()
        })
    },
    methods: {
        perBtn() {
            let myChart = echarts.init(document.getElementById('perChart'))
            let option = {
                angleAxis: {
                    axisLine: {
                      show: false
                    },
                    axisLabel: {
                      show: false
                    },
                    splitLine: {
                      show: false
                    },
                    axisTick: {
                      show: false
                    },
                    min: 0,
                    max: 165,
                    boundaryGap: ['0', '100'],
                    startAngle: 199
                },
                radiusAxis: {
                    type: 'category',
                    axisLine: {
                    show: false
                    },
                    axisTick: {
                    show: false
                    },
                    axisLabel: {
                    show: false
                    },
                    data: ['a', 'b', 'c'],
                    z: 0
                },
                pointer: {// 仪表盘指针统一样式配置
                  width: 3, // 指针的宽度
                  length: '20%' // 指针长度,按照半圆半径的百分比
                  shadowColor: '#ccc', // 默认透明
                  shadowBlur: 5
                },
                polar: {
                    radius: '110%'
                },
                series: [{
                    type: 'bar',
                    data: [0, 0, this.percentage],
                    coordinateSystem: 'polar',
                    barMaxWidth: 30,
                    z: 2,
                    roundCap: false, // 是否在两端显示成圆形。
                    overlap: false, // 多组数据时进度条是否重叠。
                    color: '#C4DDF1',
                    barGap: '100%'
                    }, {
                    type: 'bar',
                    data: [0, 0, 100],
                    z: 0,
                    silent: true,
                    coordinateSystem: 'polar',
                    barMaxWidth: 30,
                    name: 'C',
                    roundCap: false, // 是否在两端显示成圆形。
                    overlap: false, // 多组数据时进度条是否重叠。
                    color: 'rgba(0,0,0,0)',
                    barGap: '-100%'
                }],
                tooltip: {
                    show: false
                }
            }
            myChart.setOption(option)
            // 让图表跟随屏幕自动的去适应
            window.addEventListener('resize', function () {
                myChart.resize()
            })
        }
    }
}
</script>
<style lang="scss" scoped>
#perChart{
    width: 975px;
    height: 733px;
    margin: 0 auto;
    margin-left: -122px;
    margin-top: -6px;
}
.per_page{
    width: 730px;
    height: 490px;
    position: relative;
    overflow: hidden;
    margin: 0 auto;
    .per_img{
        width: 730px;
        position: absolute;
        top: 0;
        right: 0;
    }
    .per_bg{
        width: 300px;
        text-align: center;
        position: absolute;
        top: 42%;
        right: 30%;
        p{
            margin: 0;
            line-height: 100px;
            color: #999;
            font-size: 30px;
        }
        P:nth-child(2){
            color: #043B6B;
            font-size: 160px;
            font-weight: bold;
        }
    }
}
</style>
图例二
<template>
  <div class="per_page">
    <div id="perChart"></div>
    <div class="item_txt">
        <p>超过{{IndexDesc}}该年龄段的用户</p>
        <p>{{title}}指数满分为100</p>
    </div>
  </div>
</template>
<script>
import * as echarts from 'echarts'
export default {
  props: {
    title: {
      type: String,
      default: ''
    },
    percentage: {
      type: Number,
      default: 0
    },
    IndexDesc: {
      type: String,
      default: ''
    }
  },
  created() {
    this.$nextTick(() => {
      this.perBtn()
    })
  },
  methods: {
    perBtn() {
      let myChart = echarts.init(document.getElementById('perChart'))
      let option = {
        series: [
          {
            type: 'gauge',
            radius: 185,
            progress: {
              show: true,
              width: 16
            },
            axisLine: {
              lineStyle: {
                width: 38
              }
            },
            splitLine: {
              length: 20,
              lineStyle: {
                width: 2,
                color: '#235C8A'
              }
            },
            itemStyle: {
                color: '#4d8fc6'
            },
            axisLabel: {
              distance: 50, // 文字离表盘的距离
              color: '#235C8A',
              fontSize: 18
            },
            detail: {
              valueAnimation: true,
              fontSize: 50,
              color: '#235C8A'
            },
            pointer: {
              // width: 3, // 指针的宽度
              length: '45%' // 指针长度,按照半圆半径的百分比
            },
            title: { // 设置仪表盘中间显示文字样式
              offsetCenter: [0, '60%'],
              textStyle: { // 其余属性默认使用全局文本样式,详见TEXTSTYLE
                fontWeight: 'bolder',
                fontSize: 14,
                color: '#235C8A'
              }
            },
            data: [
              {
                value: this.percentage,
                name: this.title + '指数'
              }
            ]
          }
        ]
      }
      myChart.setOption(option)
      // 让图表跟随屏幕自动的去适应
      window.addEventListener('resize', function () {
        myChart.resize()
      })
    }
  }
}
</script>
<style lang="scss" scoped>
#perChart {
  width: 210mm;
  height: 110mm;
  margin: 0 auto;
}
.item_txt{
    margin-bottom: 150px;
    margin-top: -70px;
    p:first-child{
        color: #043B6B;
        font-size: 5mm;
        margin: 0;
    }
    p:nth-child(2){
        color: #999;
        font-size: 4mm;
    }
}
</style>
图例三
let colorList = ['#8c93f7', '#bbbfed', '#78b6ff', '#75d8c6'];
let Sorce = 20;
this.shuzhi = Number((Sorce / 100).toFixed(1));
let _this = this;
var option = {
  series: [
    {
      type: 'gauge',
      startAngle: 180,
      endAngle: 0,
      min: 0,
      max: 1,
      splitNumber: 10,
      axisLine: {
        lineStyle: {
          width: 30,
          color: [
            [0.4, colorList[0]],
            [0.8, colorList[1]],
            [1, colorList[2]]
          ]
        }
      },
      pointer: {
        icon: 'path://M12.8,0.7l12,40.1H0.7L12.8,0.7z',
        length: '15%',
        width: 15,
        offsetCenter: [0, '-60%'],
        itemStyle: {
          color: 'auto'
        }
      },
      axisTick: {
        show: false,
        length: 12,
        lineStyle: {
          color: 'auto',
          width: 2
        }
      },
      splitLine: {
        show: false,
        length: 20,
        lineStyle: {
          color: 'auto',
          width: 5
        }
      },
      axisLabel: {
        color: '#464646',
        fontSize: 16,
        distance: -75,
        formatter: function (value) {
          if (value === _this.shuzhi) {
            return '你的潜能\n现实化水平';
          } else if (value === 0) {
            return '0';
          } else if (value === 1) {
            return '100';
          }
          return '';
        }
      },
      detail: {
        show: false
      },
      data: [
        {
          value: Sorce / 100
        }
      ]
    }
  ]
};
图例四
option = {
  series: [
    {
      type: 'gauge',
      min: 0,
      max: 100,
      splitNumber: 10,
      radius: '99%',
      endAngle: -270,
      axisLine: {
        lineStyle: {
          width: '100%',
          color: [
            [
              1,
              {
                type: 'radial',
                x: 0.5,
                y: 0.5,
                x2: 1,
                y2: 1,
                colorStops: [
                  {
                    offset: 0.5,
                    color: 'rgba(105, 132, 255, 1)' // 0% 处的颜色
                  },
                  {
                    offset: 1,
                    color: 'rgba(107, 134, 255, 0.2)' // 100% 处的颜色
                  }
                ],
                globalCoord: false
              }
            ]
          ]
        }
      },
      splitLine: {
        show: false
      },
      axisTick: {
        show: false
      },
      axisLabel: {
        show: false
      },
      pointer: {
        show: false
      },
      title: {
        show: false
      },
      anchor: {
        show: false
      }
    },
    {
      type: 'gauge',
      radius: '60%',
      endAngle: -270,
      axisLine: {
        lineStyle: {
          width: '100%',
          color: [[1, '#fff']]
        }
      },
      splitLine: {
        show: false
      },
      axisTick: {
        show: false
      },
      axisLabel: {
        show: false
      },
      pointer: {
        show: false
      },
      title: {
        show: false
      },
      anchor: {
        show: false
      }
    },
    {
      type: 'gauge',
      min: 0,
      max: 100,
      splitNumber: 10,
      radius: '85%',
      endAngle: -270,
      axisLine: {
        lineStyle: {
          width: 110,
          color: [
            [0.75, '#6984FF'],
            [1, '#7A9CFF']
          ]
        }
      },
      splitLine: {
        show: false
      },
      axisTick: {
        show: false
      },
      axisLabel: {
        show: false
      },
      pointer: {
        show: false
      },
      title: {
        show: false
      },
      anchor: {
        show: false
      }
    },
    {
      type: 'gauge',
      min: 0,
      max: 100,
      splitNumber: 10,
      radius: '80%',
      progress: {
        show: true,
        width: 30
      },
      itemStyle: {
        color: '#57DCFF'
      },
      axisLine: {
        distance: 50,
        length: 18,
        lineStyle: {
          color: [[1, '#fff']],
          width: 30
        }
      },
      splitLine: {
        show: false
      },
      axisTick: {
        show: false
      },
      axisLabel: {
        distance: -80,
        color: '#ffffff',
        fontSize: 35
      },
      anchor: {
        show: false
      },
      pointer: {
        show: false
      },
      detail: {
        offsetCenter: [0, 0],
        fontSize: 100,
        color: '#6B86FF'
      },
      title: {
        // 设置仪表盘中间显示文字样式
        offsetCenter: [0, '30%'],
        textStyle: {
          fontSize: 30,
          color: '#3E4E96'
        }
      },
      data: [
        {
          value: 51,
          name: '思维力指数'
        }
      ]
    },
    {
      type: 'gauge',
      min: 0,
      max: 100,
      radius: '85%',
      splitNumber: 10,
      axisLine: {
        lineStyle: {
          color: [[1, '#57DCFF']],
          width: 3
        }
      },
      splitLine: {
        distance: -12,
        length: 12,
        lineStyle: {
          color: '#57DCFF'
        }
      },
      axisTick: {
        show: false
      },
      axisLabel: {
        show: false
      },
      pointer: {
        show: false
      },
      title: {
        show: false
      },
      anchor: {
        show: false
      }
    },
    {
      type: 'gauge',
      min: 0,
      max: 100,
      radius: '60%',
      splitNumber: 21,
      startAngle: 200,
      endAngle: -270,
      axisLine: {
        lineStyle: {
          color: [[1, '#194280']],
          width: 3
        }
      },
      splitLine: {
        distance: 0,
        length: 10,
        lineStyle: {
          color: '#18EFE2'
        }
      },
      axisTick: {
        show: false
      },
      axisLabel: {
        show: false
      },
      pointer: {
        show: false
      },
      title: {
        show: false
      },
      anchor: {
        show: false
      }
    }
  ]
};
希望我的愚见能够帮助你哦~,若有不足之处,还望指出,你们有更好的解决方法,欢迎大家在评论区下方留言支持,大家一起相互学习参考呀~

旨在为数千万中国开发者提供一个无缝且高效的云端环境,以支持学习、使用和贡献开源项目。
更多推荐


 3
3 0
0- 0


 已为社区贡献4条内容

所有评论(0)