
【jprofiler】jprofiler安装使用教程
一、背景jprofiler是一款很好的性能分析工具,我们将介绍如何在Windows和Linux上安装使用jprofiler,监控相关java工程。二、安装Windows上安装https://www.ej-technologies.com/download/jprofiler/version_92注意使用这个指定版本,Windows安装需要填写注册码,其他版本可能网上找不到注册码。JProfiler
一、背景
jprofiler是一款很好的性能分析工具,我们将介绍如何在Windows和Linux上安装使用jprofiler,监控相关java工程。
二、安装
Windows上安装
https://www.ej-technologies.com/download/jprofiler/version_92
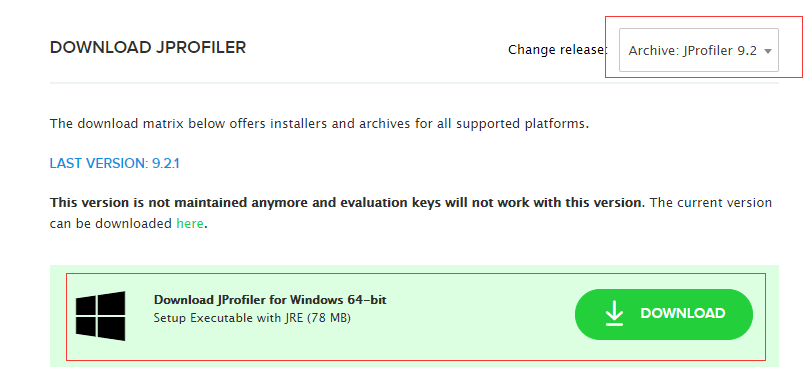
注意使用这个指定版本,Windows安装需要填写注册码,其他版本可能网上找不到注册码。
JProfiler 注册码:
L-0QhOwKlb3f-ejyjdgVCyJ#18150
S-Pny9cqLTq8-Nv8ybeLI9g#2207
L-JrWzVKm0RL-TCTPvmtOzb#35244
S-aVYVZrYIQ3-fLCoEBqrqo#10283

Linux上安装
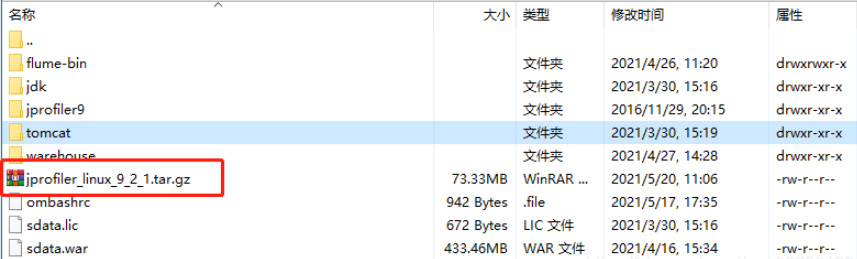
本地windows和Linux服务器要安装同一个版本的jprofiler,Linux我们选用.TAR.GZG格式的安装包。
https://www.ej-technologies.com/download/jprofiler/version_92

1. 解压 jprofiler安装包
$ tar -xzvf jprofiler_linux_9_2_1.tar.gz -C /opt/
$ ln -s /optj/profiler_linux_9_2_1 /opt/profiler
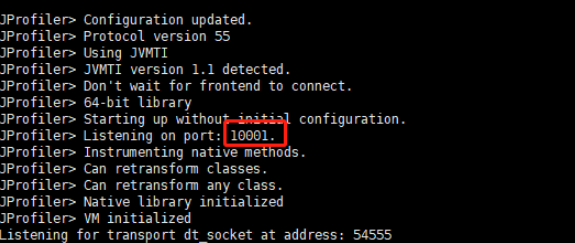
2. 工程的启动脚本 JAVA_OPTS 中添加
"-agentpath:/opt/jprofiler9/bin/linux-x64/libjprofilerti.so=port=10001,nowait"
3.重启服务器,日志出现如下内容则安装成功,10001为我们第2步配置的监听窗口
三、连接监控
1.打开本地jprofiler,点击Start Center-New Session-New Remote Integration,新建远程会话

2.选择远程电脑和操作系统

3.选择模式

4.按步骤填写服务器地址、jprofiler路径及监听端口
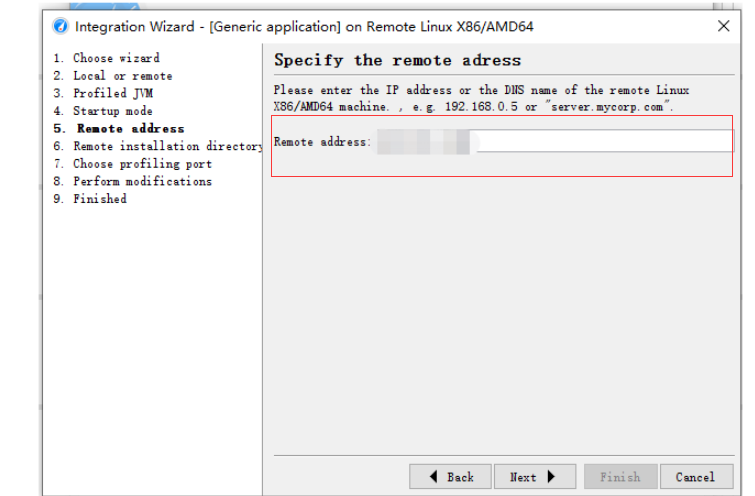

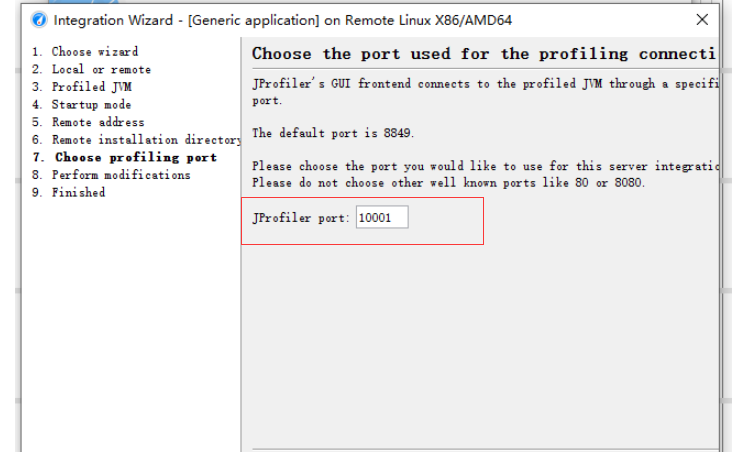
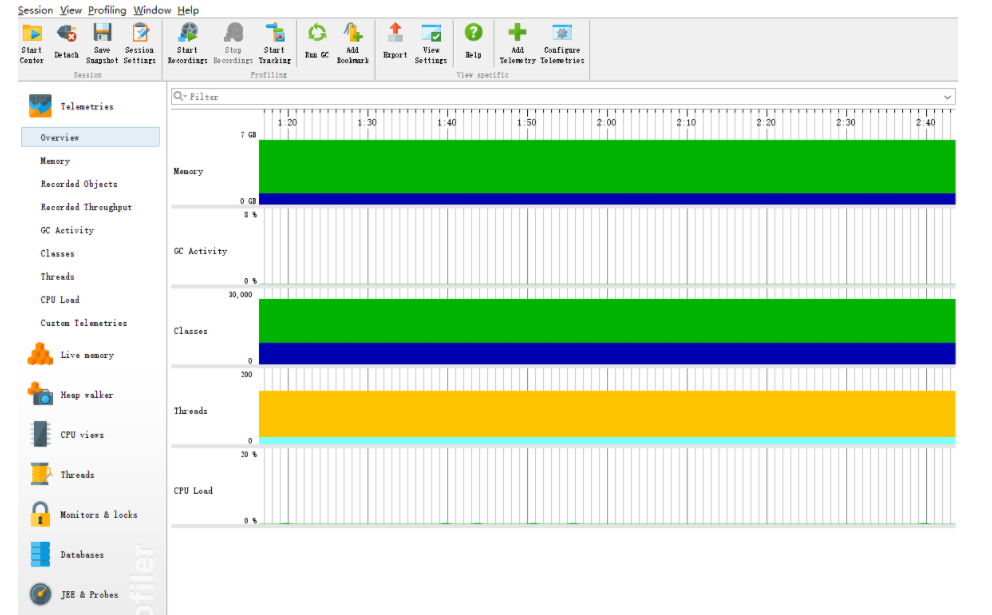
5.根据自己需要的数据选择分析模式,在弹窗中点击ok,即可连接进行性能监控

如果服务器上按照步骤都配置了,本地还是连接不上,有可能是监听端口防火墙没开,关闭服务端的防火墙或者将端口放行。
四、参考
JProfiler帮助文档
https://www.ej-technologies.com/resources/jprofiler/v/12.0/help_zh_CN/doc/main/methodCallRecording.html
Jprofiler工具安装及使用
https://www.open-open.com/lib/view/open1380112522742.html
DOWNLOAD JPROFILER
https://www.ej-technologies.com/download/jprofiler/version_92
Linux中jprofiler安装使用教程
https://blog.csdn.net/qq_35752192/article/details/117111641

旨在为数千万中国开发者提供一个无缝且高效的云端环境,以支持学习、使用和贡献开源项目。
更多推荐


 3
3 0
0- 0


 已为社区贡献6条内容

所有评论(0)