
【交互作用】01. 加法交互 & 乘法交互(R包 epiR)
【交互作用】01. 加法交互 & 乘法交互 [R包 epiR]
1. 交互作用概述
(1) 概念:
某一因素的真实效应(单独效应)随着另一因素水平的改变而改变。当两种或两种以上暴露因素同时存在时所致的效应不等于它们单个作用相联合的效应时,则称因素之间存在交互作用。
① 因素A的效应在因素B的不同水平上存在差异,则认为因素A、B之间存在交互作用。
② 因素A、B的联合效应不等于两因素独立效应之和或之积。
(2) 识别:
①统计表:所有可能交叉组合情况下的结局指标;
②统计图:观察另一因素各水平下,某因素与结局指标关系图是否平行(Addictive interation)。
(3) 理解交互作用:
在不同B因素水平,A因素的效应有统计学差异;同理,在不同A因素水平,B因素的效应也有差异。交互作用就是看二者合在一起的效应,与二者单独效应之和(相加)/之乘(相乘),相等还是不相等。不相等,那就是有交互。Mediation是解释暴露因素how导致的结局,而interaction是说明who是高风险目标人群。
首先需明确,“交互作用”是指统计学上的交互作用,不能直接说它们具有生物学意义上的交互作用。因为统计模型不止一种,你会看到有些研究中,相乘模型有统计学意义,相加模型没有统计学意义,或者相乘模型为拮抗作用,相加模型为协同作用;所以,这才有了谁更合理的争论。根据“A因素和B因素在相加尺度上具有交互作用”,可以推测有生物学交互,而不能直接写“具有生物交互作用”。同样,没检测到统计学上的交互作用,也不能说明没有生物学交互作用。⚠️注意:有无统计学交互作用很大程度上取决于所选择的模型,所以在报告有无交互作用时,需要说明分析所用的模型。
(4) 相加交互与相乘交互的差异:
统计建模中一般线性模型交互项反映的是因素间相加交互作用(additive interactions,INTA),而logistic和Cox等广义线性模型则反映因素间统计学上相乘交互作用(multiplicative interaction,INTM),即logistic乘积项仅反映统计学上的交互,而只有在生物学机制上病因因素间存在相加交互作用才可解释为相加交互作用。
(5) 评价交互作用的目的和意义:
①在资源有限的情况下,识别对某干预受益最大的人群(亚组)。
②在某一主要暴露因素不容易施加干预的情况下,识别最有可能施加干预的互作协变量以降低主要暴露因素的效应。
③揭示暴露影响疾病发生的机制。
④提高评价某暴露因素对结局影响总效应的把握度。
⑤仅从统计学角度考虑,通常包含交互作用项的模型拟合数据更好。
2. 二分类解释变量交互作用
2.1 相乘交互作用
(1) 相乘交互作用的定义:假设研究多风险因素中交互作用的两暴露因素为AB,则OR00表示AB均无暴露,即OR00=1;OR10表示A暴露、B无暴露,OR01表示A无暴露、B暴露,OR11表示A、B均暴露。则相乘交互作用INTM=ORA×B=OR11/(OR10×OR01)。
(2) 相乘交互作用的判定:logistic 等回归乘积项95%CI不包含1,表明有相乘交互作用。交互项得到的OR值<1,拮抗作用;交互项 OR>1,协同作用。
2.2 相加交互作用
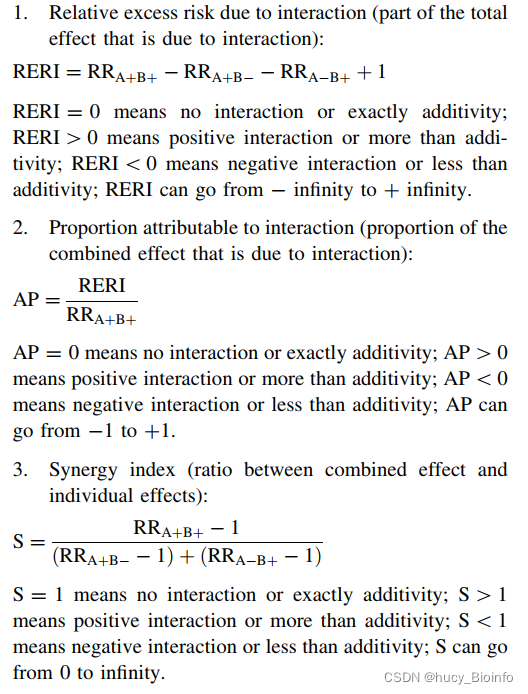
(1) 定量评价流行病学研究中暴露因素间及暴露因素与基因间相加交互作用需要3项指标:交互对比度(interaction contrast ratio,ICR)又称交互作用超额相对危险度(relative excess risk due to interaction,RERI),交互作用归因比(attributable proportion due to interaction,AP)和协同指数(the synergy index,S)。
(2) 相加交互作用3项指标定义为:
RERI = ICR = OR11 - OR10 - OR01 + 1
AP = ICR/OR11
S = (OR11 - 1)/(OR10 + OR01)=(OR11 - 1)/(OR11 + 1 - ICR)
此处公式有误,之前一直懒得去核实,现在做个修改。感谢x小x小姐姐提供的文献参考,如有需要,请自行下载原文。—— Revised: 2022-04-01
Knol MJ, VanderWeele TJ, Groenwold RH, Klungel OH, Rovers MM, Grobbee DE. Estimating measures of interaction on an additive scale for preventive exposures. Eur J Epidemiol. 2011 Jun;26(6):433-8.
在二分类logistic回归模型中,ln[P/(1-P)] = β0 + β1A + β2B + β3A×B,OR10=exp(β1),OR01=exp(β2),OR11=INTA=exp(β1 + β2 + β3)
(3) 相加交互作用的判定:如果两因素有相加交互作用,则RERI 95%CI、AP 95%CI应不包含0,S 95%CI应不包含1。超额相对危险度RERI以及归因比AP均>0,且可信区间不包括0, S>1且可信区间不包括1,表示存在交互作用,且为协同作用。RER1以及AP均<0,S<1,表示存在交互作用,且为拮抗作用。
2.3 计算置信区间CI的方法
Delta法、Wald法、轮廓似然置信区间(profile likelihood confidence intervals,PL)法、variance recovery method和percentile bootstrapping等。
3. R 代码示例
epiR R包可实现将两个二元解释变量作为交互项纳入logistic回归,计算其乘法和加法交互作用(RERI、AP、S)。置信区间的计算基于Hosmer和Lemeshow(1992)描述的delta方法。
(1) R 包安装及数据介绍:
install.packages("epiR")
library(epiR)
## Data from Rothman and Keller (1972) evaluating the effect of joint exposure to alcohol and tabacco on risk of cancer of the mouth and pharynx (cited in Hosmer and Lemeshow, 1992):
can <- c(rep(1, times = 231), rep(0, times = 178), rep(1, times = 11),
         rep(0, times = 38))
smk <- c(rep(1, times = 225), rep(0, times = 6), rep(1, times = 166),
         rep(0, times = 12), rep(1, times = 8), rep(0, times = 3), rep(1, times = 18),
         rep(0, times = 20))
alc <- c(rep(1, times = 409), rep(0, times = 49))
dat <- data.frame(alc, smk, can)

#因子化前后,回归分析结果一致
dat$smk <- factor(dat$smk)
dat$alc <- factor(dat$alc)
dat$can <- factor(dat$can)
summary(dat)
(2) 相乘交互作用及二元Logist回归:
# 1) 相乘交互作用及二元Logist回归:
fit <- glm(can ~ alc + smk + alc:smk, family = binomial(link = "logit"), data = dat)
summary(fit)$coefficients
coef <- summary(fit)$coefficients[,1]
se <- summary(fit)$coefficients[,2]
Results <- cbind(exp(coef),exp(coef-1.96*se),exp(coef+1.96*se))
exp(confint(fit)) #另外一种形式显示可信区间
P <- summary(fit)$coefficients[4,4]
dimnames(Results)[[2]] <- c("OR", "lower","upper")
Results

#                   OR      lower      upper
#(Intercept) 0.1500000 0.04457283  0.5047918
#alc1        3.3333333 0.70058649 15.8597280
#smk1        2.9629630 0.68002749 12.9099922
#alc1:smk1   0.9149096 0.15435605  5.4229143
从结果可知,饮酒与吸烟的乘法交互效应为0.91<1,交互P值为0.92,不显著。
(3) 相加交互作用及二元Logist回归:
# 2) 相加交互作用及二元Logist回归:
## Table 2 of Hosmer and Lemeshow (1992):
dat.glm01 <- glm(can ~ alc + smk + alc:smk, family = binomial, data = dat)
summary(dat.glm01) #P interaction= 0.92197

## What is the measure of effect modification on the additive scale?
## RERI
epi.interaction(model = dat.glm01, param = "product", coef = c(2,3,4), type = "RERI", conf.level = 0.95)
## Measure of interaction on the additive scale: RERI 3.73
## (95% CI -1.84 -- 9.32), page 453 of Hosmer and Lemeshow (1992).

#AP 和 S
epi.interaction(model = dat.glm01, param = "product", coef = c(2,3,4), type = "APAB", conf.level = 0.95)
#        est       lower     upper
#1 0.4138765 -0.07306308 0.9008162
epi.interaction(model = dat.glm01, param = "product", coef = c(2,3,4), type = "S", conf.level = 0.95)
#     est     lower    upper
#1 1.870482 0.6460433 5.415585
结果表明,加法交互的3个指标RERI、AP和S均不显著,推测可能不存在生物学交互作用。
(4) 哑变量实现交互作用:
# 3) 哑变量实现交互作用
## Rothman defines an alternative coding scheme to be employed for parameterising an interaction term. Using this approach, instead of using two risk factors and one product term to represent the interaction (as above) the risk factors are combined into one variable with (in this case)
## four levels:
## a.neg b.neg: 0 0 0
## a.pos b.neg: 1 0 0
## a.neg b.pos: 0 1 0
## a.pos b.pos: 0 0 1

dat$d <- rep(NA, times = nrow(dat))
dat$d[dat$alc == 0 & dat$smk == 0] <- 0
dat$d[dat$alc == 1 & dat$smk == 0] <- 1
dat$d[dat$alc == 0 & dat$smk == 1] <- 2
dat$d[dat$alc == 1 & dat$smk == 1] <- 3
dat$d <- factor(dat$d)

## Table 3 of Hosmer and Lemeshow (1992):
dat.glm02 <- glm(can ~ d, family = binomial, data = dat)
summary(dat.glm02)

# 1> 乘法交互尺度上的效应修饰作用
## What is the measure of effect modification on the multiplicative scale?
## See VanderWeele and Knol (2014) page 36 and Knol and Vanderweele (2012) for details.
beta1 <- as.numeric(dat.glm02$coefficients[2])
beta2 <- as.numeric(dat.glm02$coefficients[3])
beta3 <- as.numeric(dat.glm02$coefficients[4])
exp(beta3) / (exp(beta1) * exp(beta2))
## Measure of interaction on the multiplicative scale: 0.92.

# 2> 加法交互
## What is the measure of effect modification on the additive scale?
# coef: a vector listing the positions of the coefficients of the interaction terms in the model.
epi.interaction(model = dat.glm02, param = "dummy", coef = c(2,3,4), type = "RERI", conf.level = 0.95) #超额相对危险度
## Measure of interaction on the additive scale: RERI 3.73
## (95% CI -1.84 -- 9.32), page 455 of Hosmer and Lemeshow (1992).

## 计算AP、S指标
epi.interaction(model = dat.glm02, param = "dummy", coef = c(2,3,4), type = "APAB", conf.level = 0.95) #归因比
epi.interaction(model = dat.glm02, param = "dummy", coef = c(2,3,4), type = "S", conf.level = 0.95) #协同指数
# Skrondal (2003) advocates for use of the synergy index as a summary measure of additive interaction, showing that when regression models adjust for the effect of confounding variables (as in the majority of cases) RERI and AP may be biased, while S remains unbiased.
(5) 结果可视化
# 4) 可视化
# 1> 加法交互效应
ORalc <- 3.3333333
ORsmk <- 2.9629630
RERI <- 3.739848
bar_d <- matrix(c(1, 1, 1, 1,
                  ORalc-1, 0, ORalc-1, 0,
                  ORsmk-1 ,ORsmk-1, 0, 0,
                  RERI, 0, 0, 0),
                c(4,4), byrow = T,
                dimnames = list(c('U','alc','smk1','alc1 & smk1'),c("OR_A1B1","OR_A1B0","OR_A0B1","OR_A0B0")))

plot <- barplot(bar_d, legend=rownames(bar_d))
该图直观地显示了相加交互作用的大小: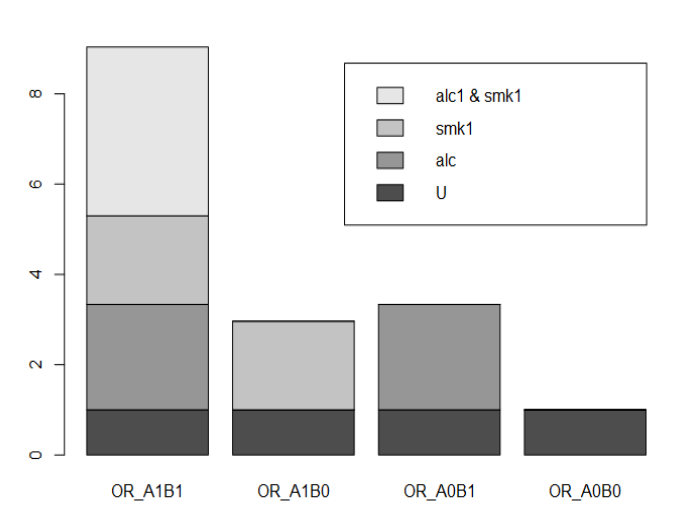
# 2> 加法交互是否显著
library(visreg)
plot(visreg(fit,xvar = "alc",by="smk",plot=F),xlab="alc",ylab="predict",overlay = T,partial = F,rug=F)
legend("topleft", c("Smoke: No","Smoke: Yes"), lty=c(1,1), col=c("red","blue"), lwd=c(1,1),bty="n")
上述分析显示,RERI、AP的可信区间包含0,S的可信区间包含1,说明加性交互作用不显著。图示如下: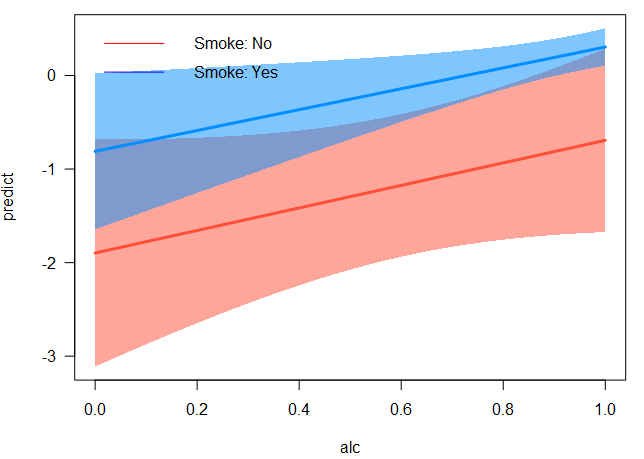
4. 实例分析
(1) 问题描述及数据:
以2004-2014年广东省先天性心脏病(先心)监测网数据库病例对照资料为例[10, 11],分析孕母是否被动吸烟(自报围孕期家庭、工作任一环境中接触吸烟平均时长>15 min/d且持续1周以上)与家庭人均月收入有无相乘和相加交互作用(表 1),并比对采用Andersson分析方法的结果。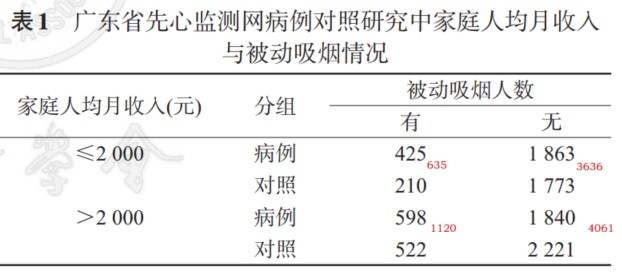
(2) 结果解释:
INTM 95%CI>1有相乘交互作用,A暴露(如,孕期被动吸烟)与B暴露(如,家庭人均月收入低)有正向相乘交互作用;Delta法、Wald法、PL法估计 ICR 95%CI>0、AP 95%CI>0,S 95%CI>1,A暴露与B暴露有协同相加交互作用,即同时暴露于A、B者,其结局(如,胎儿患先心)的发生风险显著增加。ICR和S的意义相同,AP表示全部病例中可归因于两因素交互作用的病例所占比例,如,AP=0.324(95%CI:0.153~0.519),说明全部先心病例中归因于被动吸烟与家庭人均月收入低的相加交互作用所引起的病例占32.4%。
(3) 总结:
统计学交互作用的线性模型一般为加法模型,乘积项表示有无相加交互作用;而广义线性属于乘法模型,乘积项表示有无相乘交互作用。生物学交互作用是多风险因素在发病的生物机制上的定性概念,两因素皆为病因前提下生物学机制的相互联系,包括协同和拮抗,生物学交互不同于统计模型中乘积项的分析。故相乘交互项OR值95%CI<1为负相乘,OR值95%CI>1为正相乘,相加交互项ICR值95%CI>0为协同作用,<0为拮抗作用。有时相乘与相加交互方向相悖,此时更宜运用生物学交互。在置信区间估计方法的选择上,Andersson等使用Delta法估计,结果不够稳健易造成假阴性结果。在风险比不对称时,应采用PL法,因Wald法的结果不稳定。
参考阅读:
[1] 聂志强, 欧艳秋, 庄建, 曲艳吉, 麦劲壮, 陈寄梅, 刘小清. 实现logistic与Cox回归相乘相加交互作用的临床实践宏程序. 中华流行病学杂志, 2016, 37(5): 737-740.
[2] 交互作用: 相加交互,相乘交互
[3] epiR: Tools for the Analysis of Epidemiological Data. R package version 2.0.19.
[4] https://max.book118.com/html/2016/1031/60871118.shtm
[5] https://max.book118.com/html/2017/0216/92080186.shtm

旨在为数千万中国开发者提供一个无缝且高效的云端环境,以支持学习、使用和贡献开源项目。
更多推荐

 58
58 0
0- 0


 已为社区贡献4条内容

所有评论(0)