
vue实现【echarts中 “12种” Bar柱状图图例】的组件封装及调用
1、安装echartsnpm install echarts --save2、在需要的页面引入import * as echarts from "echarts"3、创建组件personChart.vue<template><div><div id="person"></div></div></template><scr
一键AI生成摘要,助你高效阅读
问答
·
echarts组件使用参考:https://blog.csdn.net/weixin_50450473/article/details/121510438
目录
图例一:人格画像1

图例二:

图例三:

图例四:

图例五:

图例六:

图例七:
图例八:人格画像2
图例九:

图例十:
图例十一:

图例十二:

图例一
let datas = [
  { FactorName: '外向', Code: 'E', SumDivide: 19, Sort: 1, LevelTitle: '明显' },
  { FactorName: '内向', Code: 'I', SumDivide: 2, Sort: 2, LevelTitle: null },
  { FactorName: '感觉', Code: 'S', SumDivide: 16, Sort: 3, LevelTitle: '中等' },
  { FactorName: '直觉', Code: 'N', SumDivide: 10, Sort: 4, LevelTitle: null },
  { FactorName: '思维', Code: 'T', SumDivide: 1, Sort: 5, LevelTitle: null },
  { FactorName: '情感', Code: 'F', SumDivide: 19, Sort: 6, LevelTitle: '明显' },
  { FactorName: '判断', Code: 'J', SumDivide: 19, Sort: 7, LevelTitle: '明显' },
  { FactorName: '知觉', Code: 'P', SumDivide: 2, Sort: 8, LevelTitle: null }
];
let colorList = ['#326092', '#2c7eeb', '#d5f1ff', '#3dc6c8', '#becae0', '#4d8fc6'];
// 文字
let leftArr = [];
let rightArr = [];
// 数字
let leftNum = [];
let rightNum = [];

// 文字
let leftTxt = datas.map((m) => { return m.FactorName; });
leftArr = leftTxt.filter((m, mIndex) => { if (mIndex % 2 === 0) return m; }).reverse();
rightArr = leftTxt.filter((m, mIndex) => { if (mIndex % 2 !== 0) return m; }).reverse();
// 数字
datas.forEach((e) => {
  if (e.LevelTitle === '' || e.LevelTitle === null) {
    e.SumDivide = 0;
  }
  if (leftArr.indexOf(e.FactorName) > -1) {
    leftNum.push({ value: -e.SumDivide, label: e.LevelTitle });
  }
  if (rightArr.indexOf(e.FactorName) > -1) {
    rightNum.push({ value: e.SumDivide, label: e.LevelTitle });
  }
});
// let Num = datas.map((m) => { return -m.SumDivide; }).reverse();
// for (let i = 1; i <= Num.length; i++) {
//   if (i % 2 !== 0) {
//     // 左侧
//     leftNum[i].push({ value: 0, label: '' });
//   } else {
//     // 右侧
//     rightNum[i].push({ value: 0, label: '' });
//   }
// }

option = {
  grid: {
    top: '0',
    left: '3%',
    right: '4%',
    bottom: '3%',
    containLabel: true
  },
  xAxis: [
    {
      type: 'value',
      show: false,
      min: -26,
      max: 26,
      // 表格里面Y轴线条
      splitLine: {
        show: false
      }
    },
    {
      type: 'category',
      position: 'bottom'
    }
  ],
  yAxis: [
    {
      type: 'category',
      axisTick: {
        show: false
      },
      data: leftArr
    },
    {
      type: 'category',
      axisLine: {
        show: false
      },
      axisTick: {
        show: false
      },
      position: 'right',
      data: rightArr
    }
  ],
  series: [
    {
      name: 'Income',
      type: 'bar',
      barWidth: 20, // 柱图宽度
      showBackground: true,
      stack: 'Total',
      emphasis: {
        focus: 'series'
      },
      data: rightNum,
      itemStyle: {
        normal: {
          label: {
            show: true, // 是否显示
            position: 'right', // 显示位置
            color: '#000',
            formatter: function (params) {
              // 核心部分 实现自定义文字展示在柱状条顶部
              if (parseInt(params.value) === 0) {
                return '';
              } else {
                return params.data.label;
              }
            }
          },
          // 每个柱子的颜色即为colorList数组里的每一项,如果柱子数目多于colorList的长度,则柱子颜色循环使用该数组
          color: function (params) {
            return colorList[params.dataIndex];
          }
        }
      }
    },
    {
      name: 'Expenses',
      type: 'bar',
      stack: 'Total',
      emphasis: {
        focus: 'series'
      },
      data: leftNum,
      itemStyle: {
        normal: {
          label: {
            show: true,
            position: 'left',
            color: '#000',
            formatter: function (params) {
              // 核心部分 formatter 可以为字符串也可以是回调
              if (parseInt(params.value) === 0) {
                return '';
              } else {
                return params.data.label;
              }
            }
          },
          color: function (params) {
            return colorList[params.dataIndex];
          }
        }
      }
    }
  ]
};
图例二
let datas = [
  { Name: '目标执行', DivideScore: 7.1, UserScore: 6 },
  { Name: '执行力', DivideScore: 7.2, UserScore: 6.8 },
  { Name: '反馈调整', DivideScore: 6, UserScore: 4 }
];
let NameArr = datas.map((f) => { return f.Name; });
let AvgArr = datas.map((f) => { return f.DivideScore; });
let UserArr = datas.map((f) => { return f.UserScore; });
let colorList = ['#326092', '#2c7eeb'];
option = {
  title: {
    text: '目标执行综合得分',
    left: 'center'
  },
  color: colorList,
  legend: {
    itemGap: 25,
    top: 'bottom',
    data: ['我的得分', '平均得分']
  },
  grid: {
    left: '3%',
    right: '4%',
    bottom: '10%',
    containLabel: true
  },
  xAxis: {
    type: 'category',
    data: NameArr,
    axisTick: { show: false }
  },
  yAxis: {
    type: 'value',
    max: 10,
    min: 0
  },
  series: [
    {
      name: '我的得分',
      type: 'bar',
      barWidth: 20,
      data: UserArr,
      itemStyle: {
        normal: {
          label: {
            show: true, // 是否显示
            position: 'top',
            color: '#333',
            formatter: function (params) {
              return params.value;
            }
          }
        }
      }
    },
    {
      name: '平均得分',
      type: 'bar',
      barWidth: 20,
      data: AvgArr,
      itemStyle: {
        normal: {
          label: {
            show: true, // 是否显示
            position: 'top',
            color: '#333',
            formatter: function (params) {
              return params.value;
            }
          }
        }
      }
    }
  ]
};
图例三
let datas = [
  { Name: '掌握规避目标', UserScore: 4.3 },
  { Name: '成绩规避目标', UserScore: 4.3 },
  { Name: '成绩趋近目标', UserScore: 3.8 },
  { Name: '掌握趋近目标', UserScore: 3.3 }
];
let NameArr = datas.map((f) => { return f.Name; });
let CodeArr = datas.map((f) => { return f.UserScore; });
let colorList = ['#326092', '#2c7eeb', '#d5f1ff', '#3dc6c8', '#becae0', '#4d8fc6'];
option = {
  title: {
    text: '维度得分',
    left: 'center'
  },
  grid: {
    left: '3%',
    right: '4%',
    bottom: '3%',
    containLabel: true
  },
  xAxis: [
    {
      type: 'category',
      data: NameArr,
      axisTick: {
        show: false
      }
    }
  ],
  yAxis: [
    {
      type: 'value',
      max: 10,
      min: 0,
      axisTick: {
        show: false
      },
      axisLine: {
        show: false
      }
    }
  ],
  series: [
    {
      type: 'bar',
      barWidth: 30,
      data: CodeArr,
      itemStyle: {
        normal: {
          label: {
            show: true, // 是否显示
            position: 'top', // 显示位置
            color: '#000',
            formatter: function (params) {
              // 核心部分 formatter 可以为字符串也可以是回调
              if (parseInt(params.value) === 0) {
                return '';
              } else {
                return params.data.label;
              }
            }
          },
          // 每个柱子的颜色即为colorList数组里的每一项,如果柱子数目多于colorList的长度,则柱子颜色循环使用该数组
          color: function (params) {
            return colorList[params.dataIndex];
          }
        }
      }
    }
  ]
};
图例四
// 指定配置项和数据
var yData = ['鱼类', '鸟类', '爬行动物', '哺乳动物', '两栖动物'];
//百分比数据
var ratio = [45, 12, 10, 7, 6];
//100%-ratio
var surplus = [55, 88, 90, 93, 94];
option = {
  tooltip: {
    trigger: 'axis'
  },
  xAxis: {
    show: false
  },
  yAxis: {
    type: 'category',
    inverse: true,
    data: yData,
    axisLabel: {
      fontSize: 20
    },
    axisTick: {
      show: false
    },
    axisLine: {
      show: false
    }
  },
  series: [
    {
      name: '百分比数量',
      type: 'bar',
      stack: 'chart',
      z: 3,
      barWidth: 16,
      itemStyle: {
        color: function (params) {
          var colorList = [
            '#FFF52D',
            '#24FF3B',
            '#FFC22E',
            '#57E7FF',
            '#F065FF'
          ];
          return colorList[params.dataIndex];
        },
        barBorderRadius: [50, 0, 0, 50] // 统一设置四个角的圆角大小
      },
      label: {
        normal: {
          position: 'right',
          show: true,
          color: '#333',
          fontSize: 20,
          formatter: '{c}%'
        }
      },
      data: ratio
    },
    {
      name: '不占比数量',
      type: 'bar',
      stack: 'chart',
      barWidth: 16,
      itemStyle: {
        normal: {
          color: 'rgba(0,0,0,.1)',
          barBorderRadius: [0, 50, 50, 0]
        }
      },
      data: surplus
    }
  ]
};
图例五
let dataX = ['有林地', '疏林地', '灌木林地', '未成林林地', '无立木林地', '耕地', '草地', '建设用地', '水域'];
let dataY = [674, 318, 512, 318, 318, 318, 318, 318, 318];
let colorList = ['#0CB500', '#FFD634', '#01DAE2', '#FF5555', '#03B8DE', '#4AE879', '#FF8800', '#DBDBDB', '#ABEAFF'];
option = {
  fontSize: 12,
  tooltip: {
    trigger: 'axis'
  },
  grid: {
    left: 0, //左边距
    right: 0, //走边距
    top: 15, //上边距
    bottom: 0, //下边距
    containLabel: true
  },
  xAxis: {
    type: 'category',
    //坐标轴斜着显示
    axisLabel: {
      interval: 0,
      rotate: 20,
      fontSize: 18
    },
    axisLine: {
      //x轴
      show: false, //线条隐藏
      lineStyle: {
        //文字颜色
        color: '#333'
      }
    },
    axisTick: {
      //y轴刻度线
      show: false
    },
    data: dataX
  },
  yAxis: {
    type: 'value',
    boundaryGap: [0, '30%'],
    axisLine: {
      //y轴
      show: false, //线条隐藏
      lineStyle: {
        //文字颜色
        color: '#333'
      }
    },
    axisLabel: {
      fontSize: 18
    },
    //网格线颜色
    splitLine: {
      show: true,
      lineStyle: {
        color: ['#307DCB'],
        width: 1,
        type: 'solid'
      }
    },
    axisTick: {
      //y轴刻度线
      show: false
    }
  },
  series: [
    {
      data: dataY,
      type: 'bar',
      itemStyle: {
        normal: {
          color: function (params) {
            return colorList[params.dataIndex];
          },
          label: {
            show: true, //开启显示
            position: 'top', //在上方显示
            textStyle: {
              //数值样式
              color: '#333',
              fontSize: 18
            }
          }
        }
      }
    }
  ]
};
图例六
let datas = [
{ FactorName: '外向', Code: 'E', SumDivide: 6, Sort: 1, LevelTitle: '明显' },
{ FactorName: '内向', Code: 'I', SumDivide: 2, Sort: 2, LevelTitle: null },
{ FactorName: '感觉', Code: 'S', SumDivide: 8, Sort: 3, LevelTitle: '中等' },
{ FactorName: '直觉', Code: 'N', SumDivide: 9.6, Sort: 4, LevelTitle: null },
{ FactorName: '思维', Code: 'T', SumDivide: 1, Sort: 5, LevelTitle: null },
{ FactorName: '情感', Code: 'F', SumDivide: 3, Sort: 6, LevelTitle: '明显' },
{ FactorName: '判断', Code: 'J', SumDivide: 2.6, Sort: 7, LevelTitle: '明显' },
{ FactorName: '知觉', Code: 'P', SumDivide: 2, Sort: 8, LevelTitle: null }
];
let colorList = ['#326092', '#2c7eeb', '#d5f1ff', '#3dc6c8', '#becae0', '#4d8fc6'];
// 文字
let leftArr = [];
let rightArr = [];
// 数字
let leftNum = [];
let rightNum = [];
// 文字
let leftTxt = datas.map((m) => { return m.FactorName; });
leftArr = leftTxt.filter((m, mIndex) => { if (mIndex % 2 === 0) return m; }).reverse();
rightArr = leftTxt.filter((m, mIndex) => { if (mIndex % 2 !== 0) return m; }).reverse();
// 数字
datas.forEach((e) => {
if (e.LevelTitle === '' || e.LevelTitle === null) {
e.SumDivide = 0;
}
if (leftArr.indexOf(e.FactorName) > -1) {
leftNum.push({ value: -e.SumDivide, score: -e.SumDivide, label: e.LevelTitle });
}
if (rightArr.indexOf(e.FactorName) > -1) {
rightNum.push({ value: e.SumDivide, score: e.SumDivide, label: e.LevelTitle });
}
});
leftNum = leftNum.reverse();
rightNum = rightNum.reverse();
option = {
grid: {
top: '10%',
left: '3%',
right: '4%',
bottom: '3%',
containLabel: true
},
xAxis: [
{
type: 'value',
show: true,
min: -10,
max: 10,
splitNumber: 200, // 分隔线条数
splitLine: {
// 分隔线
show: false
},
axisLine: {
show: true
},
axisLabel: {
formatter: function (value, index) {
// 格式化X轴刻度信息为需要显示的
if (index === 1) {
value = -10;
} else if (index === 40) {
// 22
value = -6;
} else if (index === 78) {
value = -2.2;
} else if (index === 121) {
value = 2.2;
} else if (index === 160) {
// 22
value = 6;
} else if (index === 199) {
value = 10;
} else {
value = '';
}
return value;
}
}
}
],
yAxis: [
{
type: 'category',
axisTick: {
show: false
},
data: leftArr
},
{
type: 'category',
axisLine: {
show: false
},
axisTick: {
show: false
},
position: 'right',
data: rightArr
}
],
series: [
{
type: 'bar',
barWidth: 20, // 柱图宽度
showBackground: true,
stack: 'Total',
emphasis: {
focus: 'series'
},
data: rightNum,
markArea: {
data: [
[
{
name: '轻微',
xAxis: 0,
itemStyle: {
color: 'rgba(233,250,140,0)',
borderWidth: 1,
borderColor: '#ddd'
}
},
{
xAxis: 2.2
}
],
[
{
name: '中等',
xAxis: 2.2,
itemStyle: {
color: 'rgba(153,236,116,0)',
borderWidth: 1,
borderColor: '#ddd'
}
},
{
xAxis: 6
}
],
[
{
name: '明显',
xAxis: 6,
itemStyle: {
color: 'rgba(235,214,21,0)',
borderWidth: 1,
borderColor: '#ddd'
}
},
{
xAxis: 10
}
]
]
},
itemStyle: {
normal: {
label: {
show: true, // 是否显示
position: 'right', // 显示位置
padding: [0, -30],
color: '#fff',
textBorderWidth: 2,
fontSize: 14,
textBorderColor: '#999',
formatter: function (params) {
// 核心部分 formatter 可以为字符串也可以是回调
if (parseInt(params.value) === 0) {
return '';
} else {
return params.data.score;
}
}
},
// 每个柱子的颜色即为colorList数组里的每一项,如果柱子数目多于colorList的长度,则柱子颜色循环使用该数组
color: function (params) {
return colorList[params.dataIndex];
}
}
}
},
{
type: 'bar',
stack: 'Total',
emphasis: {
focus: 'series'
},
data: leftNum,
markArea: {
data: [
[
{
name: '轻微',
xAxis: 0,
itemStyle: {
color: 'rgba(233,250,140,0)',
borderWidth: 1,
borderColor: '#ddd'
}
},
{
xAxis: -2.2
}
],
[
{
name: '中等',
xAxis: -2.2,
itemStyle: {
color: 'rgba(153,236,116,0)',
borderWidth: 1,
borderColor: '#ddd'
}
},
{
xAxis: -6
}
],
[
{
name: '明显',
xAxis: -6,
itemStyle: {
color: 'rgba(235,214,21,0)',
borderWidth: 1,
borderColor: '#ddd'
}
},
{
xAxis: -10
}
]
]
},
itemStyle: {
normal: {
label: {
show: true,
position: 'left',
padding: [0, -30],
color: '#fff',
textBorderWidth: 2,
fontSize: 14,
textBorderColor: '#999',
formatter: function (params) {
// 核心部分 formatter 可以为字符串也可以是回调
if (parseInt(params.value) === 0) {
return '';
} else {
return params.data.score;
}
}
},
color: function (params) {
return colorList[params.dataIndex];
}
}
}
}
]
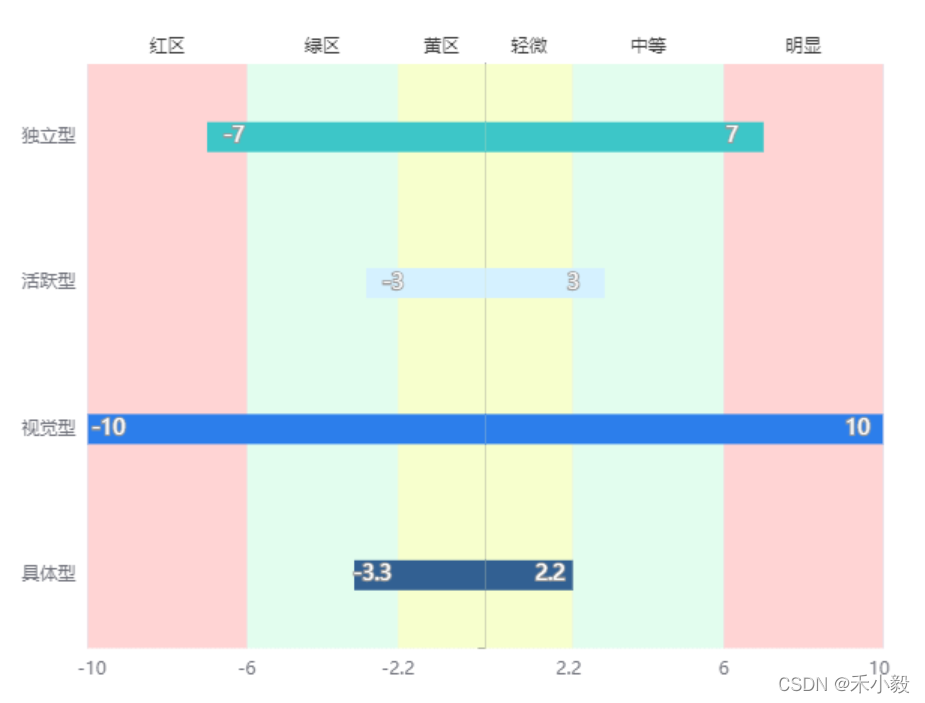
};图例七
let colorList = ['#326092', '#2c7eeb', '#d5f1ff', '#3dc6c8', '#becae0', '#4d8fc6']
option = {
grid: {
left: '3%',
right: '4%',
bottom: '3%',
containLabel: true
},
xAxis: [
{
type: 'value',
splitNumber: 200, // 分隔线条数
axisLabel: {
formatter: function(value, index) { // 格式化X轴刻度信息为需要显示的
if (index === 1) {
value = -10
} else if (index === 40) { // 22
value = -6
} else if (index === 78) {
value = -2.2
} else if (index === 121) {
value = 2.2
} else if (index === 160) { // 22
value = 6
} else if (index === 199) {
value = 10
} else {
value = ''
}
return value
}
}
}
],
yAxis: [
{
type: 'category',
axisTick: {
show: true
},
axisLine: {
show: true
},
data: ['具体型', '视觉型', '活跃型', '独立型']
}
],
series: [
{
type: 'bar',
stack: 'Total',
barWidth: 20, // 柱图宽度
itemStyle: {
normal: {
label: {
show: true, // 是否显示
position: 'right', // 显示位置
padding: [0, -30],
color: '#fff',
textBorderWidth: 2,
fontSize: 14,
textBorderColor: '#999',
formatter: function(params) { // 核心部分 formatter 可以为字符串也可以是回调
if (parseInt(params.value) === 0) {
return ''
} else {
return params.data.score
}
}
},
// 每个柱子的颜色即为colorList数组里的每一项,如果柱子数目多于colorList的长度,则柱子颜色循环使用该数组
color: function (params) {
return colorList[params.dataIndex]
}
}
},
markArea: {
// silent: true,
data: [
[{
name: '轻微',
xAxis: 0,
itemStyle: {
color: '#f7ffcd'
},
}, {
xAxis: 2.2
}],
[{
name: '中等',
xAxis: 2.2,
itemStyle: {
color: '#e2fdee'
},
}, {
xAxis: 6,
}],
[{
name: '明显',
xAxis: 6,
itemStyle: {
color: '#ffd4d4'
}
}, {
xAxis: 10,
}]
]
},
data: [2.2, 10, 3, 7]
},
{
type: 'bar',
stack: 'Total',
barWidth: 20, // 柱图宽度
itemStyle: {
normal: {
label: {
show: true, // 是否显示
position: 'left', // 显示位置
padding: [0, -30],
color: '#fff',
textBorderWidth: 2,
fontSize: 14,
textBorderColor: '#999',
formatter: function(params) { // 核心部分 formatter 可以为字符串也可以是回调
if (parseInt(params.value) === 0) {
return ''
} else {
return params.data.score
}
}
},
// 每个柱子的颜色即为colorList数组里的每一项,如果柱子数目多于colorList的长度,则柱子颜色循环使用该数组
color: function (params) {
return colorList[params.dataIndex]
}
}
},
label: {
show: true,
position: 'left'
},
markArea: {
data: [
[{
name: '黄区',
xAxis: 0,
itemStyle: {
color: '#f7ffcd'
},
}, {
xAxis: -2.2
}],
[{
name: '绿区',
xAxis: -2.2,
itemStyle: {
color: '#e2fdee'
},
}, {
xAxis: -6,
}],
[{
name: '红区',
xAxis: -6,
itemStyle: {
color: '#ffd4d4'
}
}, {
xAxis: -10,
}]
]
},
data: [-3.3, -10, -3, -7]
}
]
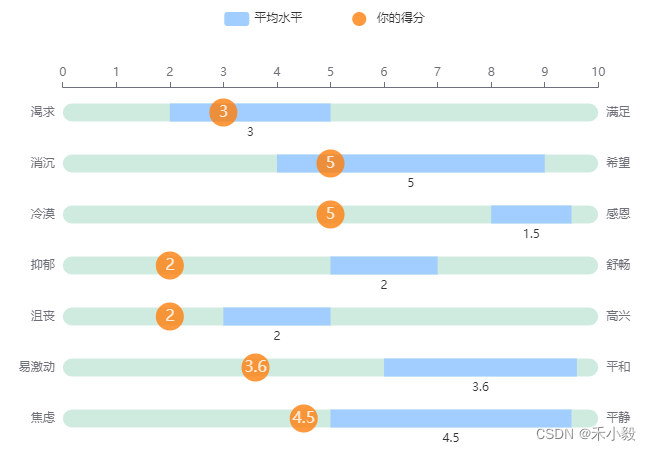
};图例八
option = {
  legend: {
    data: ['平均水平', '你的得分'],
    itemGap: 50
  },
  grid: {
    left: '2%',
    right: '2%',
    bottom: '0%',
    containLabel: true
  },
  xAxis: {
    type: 'value',
    max: 10,
    min: 0,
    position: 'top',
    splitNumber: 10,
    axisTick: { show: true },
    axisLine: { show: true },
    splitLine: {
      //网格线
      show: false
    }
  },
  yAxis: [
    {
      type: 'category',
      data: ['焦虑', '易激动', '沮丧', '抑郁', '冷漠', '消沉', '渴求'],
      axisTick: { show: false },
      axisLine: { show: false }
    },
    {
      type: 'category',
      data: ['平静', '平和', '高兴', '舒畅', '感恩', '希望', '满足'],
      axisTick: { show: false },
      axisLine: { show: false },
      position: 'right'
    }
  ],
  series: [
    {
      showBackground: true,
      backgroundStyle: {
        color: 'rgba(16, 151, 96, .2)',
        borderRadius: 30
      },
      backgroundColor: 'red',
      barBorderRadius: [15, 15, 0, 0],
      name: 'Placeholder',
      type: 'bar',
      barWidth: 18,
      stack: 'Total',
      itemStyle: {
        borderColor: 'transparent',
        color: 'transparent'
      },
      data: [5, 6, 3, 5, 8, 4, 2]
    },
    {
      name: '平均水平',
      type: 'bar',
      stack: 'Total',
      label: {
        show: true,
        position: 'bottom'
      },
      itemStyle: {
        color: '#A1CDFF'
      },
      data: [4.5, 3.6, 2, 2, 1.5, 5, 3]
    },
    {
      name: '你的得分',
      symbolSize: 28,
      type: 'scatter',
      itemStyle: {
        color: '#FF800D'
      },
      label: {
        show: true,
        color: '#fff',
        fontSize: 16
      },
      data: [4.5, 3.6, 2, 2, 5, 5, 3]
    }
  ]
};
图例九
option = {
  backgroundColor:'#333',
  tooltip: {
      trigger: 'item',
      formatter: '{b}<br/>上线人数占比:{c}%',
      position: 'top',
      backgroundColor: 'rgba(0,0,0,.5)',
      borderColor: 'rgba(255,255,255,0)',
      color: '#fff',
      extraCssText: 'box-shadow: 0 0 0 rgba(255,255,255, .5); color: #fff;',
      zIndex: 400
  },
  xAxis: {
      type: 'category',
      data: ['奉节一中','奉节一中','奉节一中','奉节一中'],
      axisLabel: {
          fontSize: 14,
          color: '#fff',
          interval: 0,
          rotate: 0,
          lineHeight: 15,
          formatter: function (value) {
              return value.split('').join('\n')
          }
      }
  },
  yAxis: {
      type: 'value',
      max: 100,
      min: 0,
      boundaryGap: true,
      axisLabel: {
          fontSize: 12,
          color: '#fff'
      },
      axisLine: {
          show: true
      },
      splitLine: {
          show: false
      }
  },
  grid: {
      top: '15%',
      left: '0%',
      right: '5%',
      bottom: '0%',
      containLabel: true
  },
  series: [
      {
          data: [50,50,80,80],
          type: 'bar',
          barWidth: 20,
          emphasis: {
              itemStyle: {
                  borderWidth: 2,
                  borderColor: '#3DE3F5',
                  shadowBlur: 10,
                  shadowColor: 'rgba(255,255,255,255.3)'
              }
          },
          itemStyle: {
              color: function (params) {
                  var colorList1 = ['#F408AB', '#4F09F3', '#ED2D98', '#0055CB', '#F408AB', '#4F09F3', '#ED2D98', '#0055CB', '#F408AB', '#4F09F3', '#ED2D98', '#0055CB'];
                  var colorList2 = ['#27B7FF', '#8CA2FF', '#FF793B', '#00EAD1', '#27B7FF', '#8CA2FF', '#FF793B', '#00EAD1', '#27B7FF', '#8CA2FF', '#FF793B', '#00EAD1'];
                  return new echarts.graphic.LinearGradient(0, 0, 0, 1, [
                      { offset: 0, color: colorList1[params.dataIndex] },
                      { offset: 1, color: colorList2[params.dataIndex] }
                  ])
              },
              barBorderRadius: [50, 50, 0, 0] // 统一设置四个角的圆角大小
          },
          label: {
              normal: {
                  position: 'top',
                  show: true,
                  color: '#fff',
                  fontSize: 14,
                  formatter: function (params) {
                      return params.data + '%'
                  }
              }
          }
      }
  ]
};
图例十
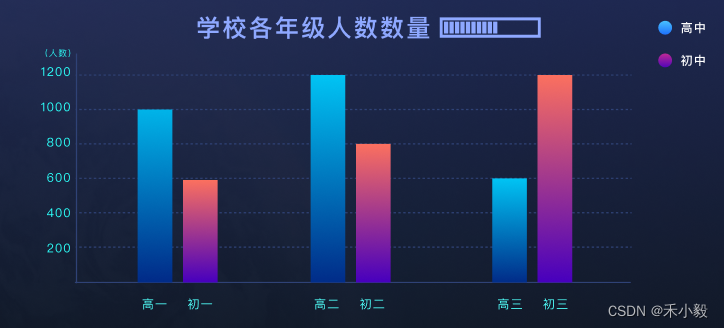
option = {
  backgroundColor: '#131724',
  legend: {
    data: [
      { name: '高中', icon: 'circle' },
      { name: '初中', icon: 'circle' }
    ],
    x: 'right',
    y: '0%',
    itemGap: 20,
    orient: 'vertical',
    textStyle: {
      color: '#fff',
      fontSize: 14
    }
  },
  tooltip: {
    trigger: 'item',
    formatter: '{b}<br/>人数:{c}',
    position: 'top',
    backgroundColor: 'rgba(0,0,0,.5)',
    borderColor: 'rgba(255,255,255,0)',
    color: '#fff',
    extraCssText: 'box-shadow: 0 0 0 rgba(255,255,255, .5); color: #fff;',
    zIndex: 400
  },
  xAxis: [
    {
      type: 'category',
      data: ['高一', '高二', '高三'],
      axisLabel: {
        fontSize: 14,
        color: '#4FFFFA',
        padding: [0, 0, 0, -35]
      },
      axisLine: {
        show: true,
        lineStyle: {
          color: '#2F4276'
        }
      },
      axisTick: {
        show: false
      }
    },
    {
      type: 'category',
      data: ['初一', '初二', '初三'],
      axisLabel: {
        fontSize: 14,
        color: '#4FFFFA',
        padding: [0, 0, 0, 40]
      },
      position: 'bottom',
      axisLine: {
        show: true,
        lineStyle: {
          color: '#2F4276'
        }
      },
      axisTick: {
        show: false
      }
    }
  ],
  yAxis: {
    type: 'value',
    name: '(人数)',
    nameLocation: 'end',
    nameGap: 13,
    nameTextStyle: {
      color: '#2CFFF9',
      fontSize: 10,
      padding: [0, 0, 5, -30]
    },
    nameRotate: 360,
    max: 1200,
    min: 0,
    boundaryGap: true,
    axisLabel: {
      fontSize: 14,
      color: '#4FFFFA'
    },
    axisLine: {
      show: true,
      lineStyle: {
        color: '#2F4276'
      }
    },
    splitLine: {
      show: false
    }
  },
  grid: {
    top: '15%',
    left: '0%',
    right: '5%',
    bottom: '5%',
    containLabel: true
  },
  series: [
    {
      name: '高中',
      data: [
        { name: '高一', value: 200 },
        { name: '高二', value: 600 },
        { name: '高三', value: 1000 }
      ],
      type: 'bar',
      barWidth: 28,
      emphasis: {
        itemStyle: {
          borderWidth: 2,
          borderColor: '#3DE3F5',
          shadowBlur: 10,
          shadowColor: 'rgba(255,255,255,255.3)'
        }
      },
      itemStyle: {
        color: {
          type: 'linear',
          x: 0,
          y: 0.5,
          x2: 0,
          y2: 1,
          colorStops: [
            {
              offset: 0,
              color: '#00B4E9' // 0% 处的颜色
            },
            {
              offset: 1,
              color: '#012C89' // 100% 处的颜色
            }
          ],
          global: false // 缺省为 false
        }
      }
    },
    {
      name: '初中',
      data: [
        { name: '初一', value: 500 },
        { name: '初二', value: 800 },
        { name: '初三', value: 1100 }
      ],
      type: 'bar',
      barWidth: 28,
      emphasis: {
        itemStyle: {
          borderWidth: 2,
          borderColor: '#3DE3F5',
          shadowBlur: 10,
          shadowColor: 'rgba(255,255,255,255.3)'
        }
      },
      itemStyle: {
        color: {
          type: 'linear',
          x: 0,
          y: 0.5,
          x2: 0,
          y2: 1,
          colorStops: [
            {
              offset: 0,
              color: '#FB705F' // 0% 处的颜色
            },
            {
              offset: 1,
              color: '#4800BD' // 100% 处的颜色
            }
          ],
          global: false // 缺省为 false
        }
      }
    }
  ]
};
图例十一
option = {
  title: {
    subtext: '注:学习风格分值高低仅代表风格类型偏向,没有优劣之分',
    top: '5%'
  },
  legend: {
    x: 'left',
    y: '1%',
    itemGap: 0,
    textStyle: {
      color: '#333',
      fontSize: 14
    }
  },
  xAxis: [
    {
      type: 'category',
      data: ['感悟', '视觉', '活跃冲动', '反思沉思', '序列'],
      axisLabel: {
        padding: [0, 0, 0, -35],
        fontSize: 14,
        color: '#333',
        interval: 0,
        rotate: 0,
        lineHeight: 15,
        formatter: function (value) {
          return value.split('').join('\n');
        }
      },
      // 坐标轴轴线相关设置
      axisLine: {
        show: true, // 是否显示坐标轴轴线
        symbol: ['none', 'arrow'], // 轴线两边的箭头,none表示没有箭头,arrow表示有箭头,可取值为字符串或长度为2的数组:默认不显示箭头 'none'。两端都显示箭头 'arrow',只在末端显示箭头 ['none', 'arrow']
        symbolSize: [10, 25], // 轴线两边的箭头的大小,第一个数字表示宽度(垂直坐标轴方向),第二个数字表示高度(平行坐标轴方向),默认值[10, 15]。
        symbolOffset: 25, // 轴线两边的箭头的偏移,如果是数组,第一个数字表示起始箭头的偏移,第二个数字表示末端箭头的偏移;如果是数字,表示这两个箭头使用同样的偏移。
        // 坐标轴轴线样式设置
        lineStyle: {
          color: '#21a6e6',
          width: 2
        }
      },
      axisTick: {
        show: false
      }
    },
    {
      name: '学习风格',
      nameLocation: 'center',
      nameGap: 15,
      nameTextStyle: {
        color: '#21a6e6',
        fontSize: 14,
        fontWeight: 600,
        padding: [0, 0, 0, 950]
      },
      type: 'category',
      data: ['直觉', '言语', '活跃敏捷', '反思缓慢', '综合'],
      axisLabel: {
        padding: [0, 0, 0, 40],
        fontSize: 14,
        color: '#333',
        interval: 0,
        rotate: 0,
        lineHeight: 15,
        formatter: function (value) {
          return value.split('').join('\n');
        }
      },
      position: 'bottom',
      axisTick: {
        show: false
      }
    },
    {
      type: 'value',
      show: false,
      min: 0,
      max: 5
    }
  ],
  yAxis: {
    type: 'value',
    name: '人数',
    nameTextStyle: {
      fontSize: 14,
      fontWeight: 600,
      padding: [0, 0, -40, -40]
    },
    nameRotate: 360,
    max: 1200,
    min: 0,
    boundaryGap: false,
    splitLine: {
      show: false
    },
    axisLabel: {
      show: false
    },
    axisTick: {
      show: false
    },
    // 坐标轴轴线相关设置
    axisLine: {
      show: true, // 是否显示坐标轴轴线
      symbol: ['none', 'arrow'], // 轴线两边的箭头,none表示没有箭头,arrow表示有箭头,可取值为字符串或长度为2的数组:默认不显示箭头 'none'。两端都显示箭头 'arrow',只在末端显示箭头 ['none', 'arrow']
      symbolSize: [10, 25], // 轴线两边的箭头的大小,第一个数字表示宽度(垂直坐标轴方向),第二个数字表示高度(平行坐标轴方向),默认值[10, 15]。
      symbolOffset: 25, // 轴线两边的箭头的偏移,如果是数组,第一个数字表示起始箭头的偏移,第二个数字表示末端箭头的偏移;如果是数字,表示这两个箭头使用同样的偏移。
      // 坐标轴轴线样式设置
      lineStyle: {
        color: '#21a6e6',
        width: 2
      }
    }
  },
  grid: {
    top: '24%',
    left: '5%',
    right: '5%',
    bottom: '15%'
  },
  series: [
    {
      name: ' ',
      data: [200, 300, 500, 600, 700],
      xAxisIndex: 0,
      type: 'bar',
      barWidth: 28,
      itemStyle: {
        color: {
          type: 'linear',
          x: 0,
          y: 0.5,
          x2: 0,
          y2: 1,
          colorStops: [
            {
              offset: 0,
              color: '#00B4E9' // 0% 处的颜色
            },
            {
              offset: 1,
              color: '#012C89' // 100% 处的颜色
            }
          ],
          global: false // 缺省为 false
        }
      }
    },
    {
      name: '表示对立偏向',
      xAxisIndex: 0,
      data: [500, 800, 550, 900, 1100],
      type: 'bar',
      barWidth: 28,
      itemStyle: {
        color: {
          type: 'linear',
          x: 0,
          y: 0.5,
          x2: 0,
          y2: 1,
          colorStops: [
            {
              offset: 0,
              color: '#FB705F' // 0% 处的颜色
            },
            {
              offset: 1,
              color: '#4800BD' // 100% 处的颜色
            }
          ],
          global: false // 缺省为 false
        }
      }
    },
    {
      type: 'bar',
      xAxisIndex: 2,
      markArea: {
        label: {
          color: '#333',
          fontSize: 16,
          fontWeight: 600
        },
        data: [
          [
            {
              name: '感知信息',
              xAxis: 0,
              itemStyle: {
                color: 'rgba(210,243,202,.5)'
              }
            },
            {
              xAxis: 1
            }
          ],
          [
            {
              name: '输入信息',
              xAxis: 1,
              itemStyle: {
                color: 'rgba(226,212,233,.5)'
              }
            },
            {
              xAxis: 2
            }
          ],
          [
            {
              name: '处理信息',
              xAxis: 2,
              itemStyle: {
                color: 'rgba(243,236,208,.8)'
              }
            },
            {
              xAxis: 4
            }
          ],
          [
            {
              name: '理解信息',
              xAxis: 4,
              itemStyle: {
                color: 'rgba(249,230,245,.6)'
              }
            },
            {
              xAxis: 5
            }
          ]
        ]
      }
    }
  ]
};
图例十二
// 配置数据
let yData = ['奉节一中', '奉节一中', '爬行动物', '哺乳动物', '两栖动物'];
let yDataRight = [1000, 1000, 1000, 1000, 1000];
//百分比数据
let ratio = [45, 12, 10, 7, 6];
//100%-ratio
let surplus = [55, 88, 90, 93, 94];

option = {
  backgroundColor: '#173565',
  tooltip: {
    trigger: 'axis'
  },
  grid: {
    top: '2%',
    left: '0%',
    right: '0%',
    bottom: '0%',
    containLabel: true
  },
  xAxis: {
    show: false
  },
  yAxis: [
    {
      type: 'category',
      inverse: true,
      data: yData,
      axisLabel: {
        fontSize: 20,
        color: '#fff'
      },
      axisTick: {
        show: false
      },
      axisLine: {
        show: false
      }
    },
    {
      type: 'category',
      position: 'right',
      data: yDataRight,
      axisLine: {
        show: false
      },
      axisTick: {
        show: false
      },
      axisLabel: {
        formatter: '{value}人',
        fontSize: 14,
        color: '#fff'
      }
    }
  ],
  series: [
    {
      name: '百分比数量',
      type: 'bar',
      stack: 'chart',
      z: 3,
      barWidth: 24,
      itemStyle: {
        color: function (params) {
          var colorList1 = ['#F408AB','#4F09F3','#ED2D98','#0055CB','#F408AB','#4F09F3','#ED2D98','#0055CB','#F408AB','#4F09F3','#ED2D98','#0055CB'];
          var colorList2 = ['#27B7FF','#8CA2FF','#FF793B','#00EAD1','#27B7FF','#8CA2FF','#FF793B','#00EAD1','#27B7FF','#8CA2FF','#FF793B','#00EAD1'];
          return new echarts.graphic.LinearGradient(1, 0, 0, 0, [
            { offset: 0, color: colorList1[params.dataIndex] },
            { offset: 1, color: colorList2[params.dataIndex] }
          ]);
        },
        barBorderRadius: [50, 0, 0, 50] // 统一设置四个角的圆角大小
      },
      label: {
        normal: {
          position: 'start',
          padding: [5, 0, 0, 20],
          show: true,
          color: '#fff',
          fontSize: 14,
          formatter: function (params) {
            return params.data + '人';
          }
        }
      },
      data: ratio
    },
    {
      name: '不占比数量',
      type: 'bar',
      stack: 'chart',
      barWidth: 24,
      itemStyle: {
        normal: {
          color: '#5878A9',
          barBorderRadius: [0, 50, 50, 0]
        }
      },
      data: surplus
    }
  ]
};
希望我的愚见能够帮助你哦~,若有不足之处,还望指出,你们有更好的解决方法,欢迎大家在评论区下方留言支持,大家一起相互学习参考呀~

旨在为数千万中国开发者提供一个无缝且高效的云端环境,以支持学习、使用和贡献开源项目。
更多推荐


 1
1 0
0- 0


 已为社区贡献4条内容

所有评论(0)