
Android WebView 页面性能监控实现
在上一篇 Android WebView 开发使用笔记 中记录了WebView的一些使用方法以及注意事项,在这一篇,我将对WebView中页面资源加载以及JS错误的监控实现进行详细的介绍。使用方法首先贴一下代码 https://github.com/jwcqc/WebViewMonitor核心其实就是 https://github.com/jwcqc/WebViewMonitor/
在上一篇 Android WebView 开发使用笔记 中记录了WebView的一些使用方法以及注意事项,在这一篇,我将对WebView中页面资源加载以及JS错误的监控实现进行详细的介绍。
使用方法
首先贴一下代码 https://github.com/jwcqc/WebViewMonitor
核心其实就是 https://github.com/jwcqc/WebViewMonitor/blob/master/app/src/main/assets/collector.js 这个js文件,当WebView中页面加载完成后,通过重写WebViewClient的onPageFinished(WebView view, String url) 方法,调用WebView的loadUrl方法加载一段JS,新加一个script标签到head标签中,并在script中包含要注入的collecotr.js的url地址,再为加入的script标签添加onload事件,确保该script已加载完成后调用js文件中编写好的的startWebViewMonitor()方法即可,代码如下:
String inject = "javascript:" +
                "   (function() { " +
                "       var script=document.createElement('script');  " +
                "       script.setAttribute('type','text/javascript');  " +
                "       script.setAttribute('src', '" + injectJsUrl + "'); " +
                "       document.head.appendChild(script); " +
                "       script.onload = function() {" +
                "           startWebViewMonitor();" +
                "       }; " +
                "    }" +
                "    )();";

webview.loadUrl(inject );
在collecor.js中,分别写有两个方法,用来发送监控信息到Android本地对象中对应的方法上:
function sendResourceTiming(e) {
    myObj.sendResource(JSON.stringify(e))
};

function sendErrors() {
    var err = errorMonitor.getError();
    if (err.length > 0) {
        var errorInfo = {
            type: "monitor_error",
            payload: {
                url: hrefUrl,
                domain: hostname,
                uri: pathname,
                error_list: err
            }
        };

        myObj.sendError(JSON.stringify(errorInfo))
    }
};
如上面代码所示,myObj是通过调用WebView的addJavascriptInterface方法添加的一个映射对象,添加的代码如下所示:
webview.addJavascriptInterface(new JSObject(), "myObj");在JSObject类中分别有相应的方法:
public class JSObject {

    @JavascriptInterface
    public void sendResource(String msg) {
       //handleResource(msg);
    }

    @JavascriptInterface
    public void sendError(String msg) {
        //handleError(msg);
    }
}到此便可以在sendResource和sendError两个方法中分别对监控到的资源请求数据、js错误数据进行处理,比如保存到数据库或发送给后台服务器等,这个则跟具体的业务有关。
可以发现,整个监控过程只需注入一段js到页面标签中即可,便会在页面中自动引入collector.js文件实现功能,并不需要页面代码进行多余的操作,整个过程非常的方便。
JS代码的实现
页面耗时、资源文件耗时的获得
这个主要是通过Performance API实现的,可以参考以下两篇文章进行了解,也打开浏览器,进入到控制台,输入performance即可进行查看
http://javascript.ruanyifeng.com/bom/performance.html
http://www.bubuko.com/infodetail-1228020.html
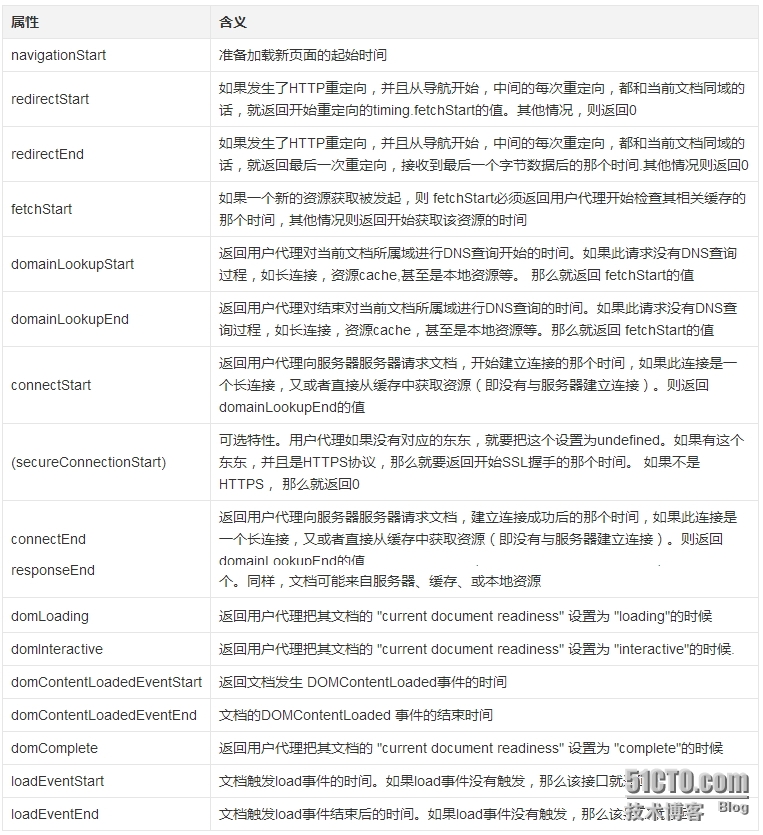
在collecor.js中主要用到了页面加载Navigation Timing和页面资源加载Resource Timing,这两个API非常有用,可以帮助我们获取页面的domready时间、onload时间、白屏时间等,以及单个页面资源在从发送请求到获取到response各阶段的性能参数。需要注意的是使用这两个API需要在页面完全加载完成之后,但是由于我们是在onPageFinished方法中才插入的js,因此这一点完全不用担心。
下图是列出了PerformanceTiming对象包含的页面性能属性,其中包括各种与浏览器性能有关的时间数据,可以提供浏览器处理网页各个阶段的耗时
下图能更加直观的展示,这些数据直接的先后次序关系
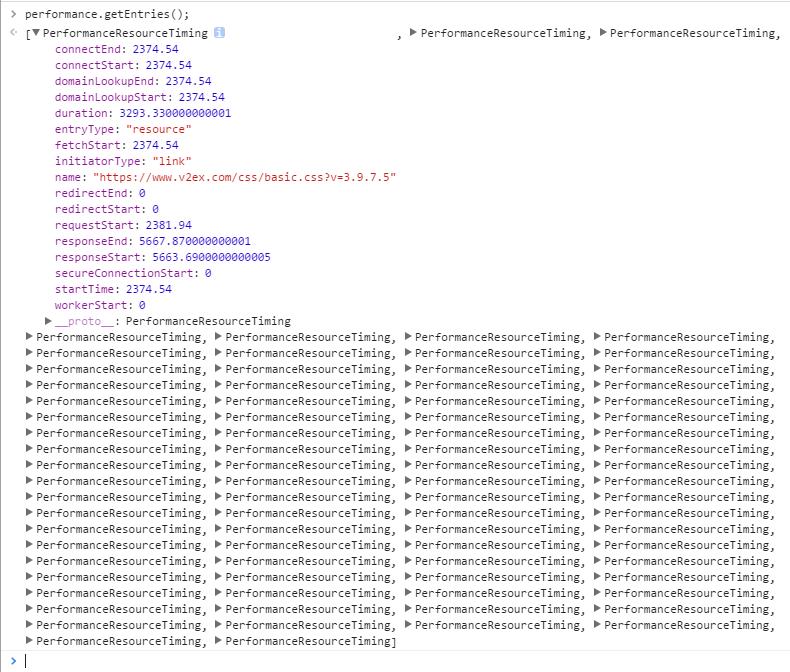
至于Resource Timing API,这个主要用来获取到单个静态资源(JS,CSS,图片,音频视频等等)从开始发出请求到获取响应之间各个阶段的Timing,可以在Chrome的console中输入performance.getEntries()即可看到效果,它列出了所有静态资源的数组列表,如下图所示:
明白这个原理之后,我们要做的,只需在collector.js中获得这个performance对象,然后取得需要的属性进行格式化然后返回即可,代码实现如下:
var performanceTiming = function() {
    function navigationTiming() {
        if (!e.performance || !e.performance.timing) return {};
        var time = e.performance.timing;
        return {
            navigationStart: time.navigationStart,
            redirectStart: time.redirectStart,
            redirectEnd: time.redirectEnd,
            fetchStart: time.fetchStart,
            domainLookupStart: time.domainLookupStart,
            domainLookupEnd: time.domainLookupEnd,
            connectStart: time.connectStart,
            secureConnectionStart: time.secureConnectionStart ? time.secureConnectionStart: time.connectEnd - time.secureConnectionStart,
            connectEnd: time.connectEnd,
            requestStart: time.requestStart,
            responseStart: time.responseStart,
            responseEnd: time.responseEnd,
            unloadEventStart: time.unloadEventStart,
            unloadEventEnd: time.unloadEventEnd,
            domLoading: time.domLoading,
            domInteractive: time.domInteractive,
            domContentLoadedEventStart: time.domContentLoadedEventStart,
            domContentLoadedEventEnd: time.domContentLoadedEventEnd,
            domComplete: time.domComplete,
            loadEventStart: time.loadEventStart,
            loadEventEnd: time.loadEventEnd,
            pageTime: pageTime || (new Date).getTime()
        }
    }
    function resourceTiming() {
        if (!e.performance || !e.performance.getEntriesByType) return [];
        for (var time = e.performance.getEntriesByType("resource"), resArr = [], i = 0; i < time.length; i++) {
            var i = time[i].secureConnectionStart ? time[i].secureConnectionStart: time[i].connectEnd - time[i].secureConnectionStart,
            res = {
                connectEnd: time[i].connectEnd,
                connectStart: time[i].connectStart,
                domainLookupEnd: time[i].domainLookupEnd,
                domainLookupStart: time[i].domainLookupStart,
                duration: time[i].duration,
                entryType: time[i].entryType,
                fetchStart: time[i].fetchStart,
                initiatorType: time[i].initiatorType,
                name: time[i].name,
                redirectEnd: time[i].redirectEnd,
                redirectStart: time[i].redirectStart,
                requestStart: time[i].requestStart,
                responseEnd: time[i].responseEnd,
                responseStart: time[i].responseStart,
                secureConnectionStart: i,
                startTime: time[i].startTime
            };
            resArr.push(res);
        }
        return resArr;
   }
   return {
       cacheResourceTimingLength: 0,
       getNavigationTiming: function() {
           return navigationTiming();
       },
       getResourceTiming: function() {
           var timing = resourceTiming();
           var len = timing.length;
           return timing.length != this.cacheResourceTimingLength ?
               (timing = timing.slice(this.cacheResourceTimingLength, len), this.cacheResourceTimingLength = len, timing) : []
        }
    }
}();
最后调用performanceTiming.getNavigationTiming()或者performanceTiming.getResourceTiming()便能返回所有数据。
如果需要获得其他对我们比较有用的页面性能数据,比如DNS查询耗时、TCP链接耗时、request请求耗时、解析dom树耗时、白屏时间、domready时间、onload时间等,可以通过上面的performance.timing各个属性的差值计算得到,方法如下:
DNS查询耗时 :domainLookupEnd - domainLookupStart
TCP链接耗时 :connectEnd - connectStart
request请求耗时 :responseEnd - responseStart
解析dom树耗时 : domComplete- domInteractive
白屏时间 :responseStart - navigationStart
domready时间 :domContentLoadedEventEnd - navigationStart
onload时间 :loadEventEnd - navigationStart
JS错误的捕获
只需通过调用addEventListener(type, listener, useCapture),type传error即可,如果对这个方法不熟悉,可参考 http://www.runoob.com/jsref/met-element-addeventlistener.html
var errorMonitor = function() {
    var errors = [];
    return e.addEventListener && e.addEventListener("error",
        function(e) {
            var eInfo = {};
            eInfo.time = e.timeStamp || (new Date).getTime(),
            eInfo.url = e.filename,
            eInfo.msg = e.message,
            eInfo.line = e.lineno,
            eInfo.column = e.colno,
            e.error ? (eInfo.type = e.error.name, eInfo.stack = e.error.stack) : (eInfo.msg.indexOf("Uncaught ") > -1 ? eInfo.stack = eInfo.msg.split("Uncaught ")[1] + " at " + eInfo.url + ":" + eInfo.line + ":" + eInfo.column: eInfo.stack = eInfo.msg + " at " + eInfo.url + ":" + eInfo.line + ":" + eInfo.column, eInfo.type = eInfo.stack.slice(0, eInfo.stack.indexOf(":"))),
                eInfo.type.toLowerCase().indexOf("script error") > -1 && (eInfo.type = "ScriptError"),
                    errors.push(eInfo);
            }, !1), {
            getError: function() {
                return errors.splice(0, errors.length);
            }
        }
    }();
TODO
- 目前只是完成了对数据的采集,采集之后对数据的处理还没有进行,但这个跟具体的业务挂钩,不是这篇文章的重点;
- 现在还只能监控到页面性能数据以及js错误等,下一步考虑支持Ajax,获取ajax请求过程中各个阶段的耗时。

旨在为数千万中国开发者提供一个无缝且高效的云端环境,以支持学习、使用和贡献开源项目。
更多推荐

 2
2 0
0- 0


 已为社区贡献1条内容

所有评论(0)